497
Views
11
CrossRef citations to date
0
Altmetric
Research Article

Hyperthermia worsens ischaemic brain injury through destruction of microvessels in an embolic model in rats

, , &
Pages 24-32 | Received 28 Jun 2011, Accepted 10 Oct 2011, Published online: 11 Jan 2012

Figures & data

Table I.  Physiological parameters.a

Figure 1. Hyperthermia enlarged the infarct in an embolic model of ischaemic brain injury. Representative TTC-stained brain sections from normothermic (A) and hyperthermic (B) rats, sacrificed at 24 h after the MCA occlusion. The infarct volume was measured in the TTC stained brain sections at 24 h after MCA occlusion (C). *p < 0.01 compared with the normothermic group.
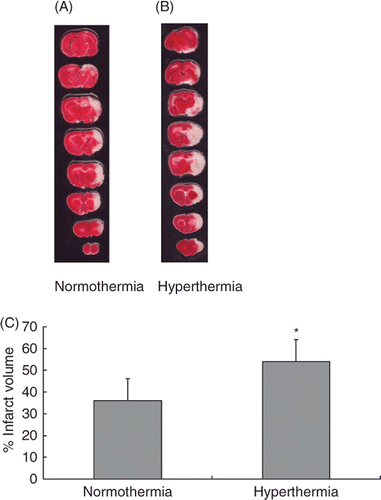
Figure 1. Hyperthermia enlarged the infarct in an embolic model of ischaemic brain injury. Representative TTC-stained brain sections from normothermic (A) and hyperthermic (B) rats, sacrificed at 24 h after the MCA occlusion. The infarct volume was measured in the TTC stained brain sections at 24 h after MCA occlusion (C). *p < 0.01 compared with the normothermic group.

Figure 2. Ischaemic swelling in the cortex (A) and striatum (B). The swelling was measured in the TTC-stained brain sections at 24 h after the MCA occlusion. *p < 0.05, **p < 0.01 compared with the normothermic group.
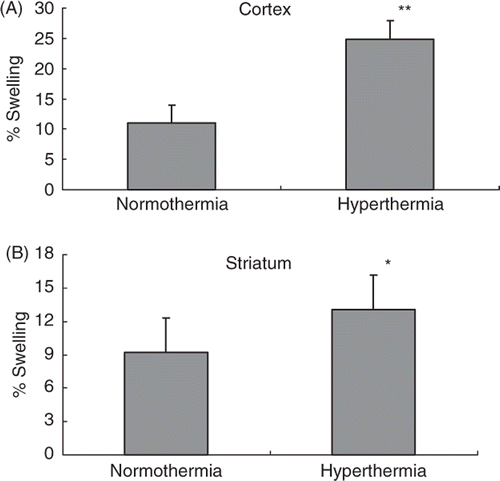
Figure 2. Ischaemic swelling in the cortex (A) and striatum (B). The swelling was measured in the TTC-stained brain sections at 24 h after the MCA occlusion. *p < 0.05, **p < 0.01 compared with the normothermic group.

Figure 3. (A) The reduction of the number of collagen type IV positive stain microvessels in the cortex. The microvessel numbers are expressed as percentage changes between the ipsilateral and contralateral hemispheres to the occluded MCA. *p < 0.01, **p < 0.001 compared with the normothermic group. (B) Number of collagen type IV positive stain microvessels in the striatum. *p < 0.01, **p < 0.001 compared with the normothermic group. (C) Representative photomicrographs show microvessels stained by Cy™3-conjugated anti-type IV collagen at 24 h after MCA occlusion in the cortex. Left panel: normothermic and right panel: hyperthermic (scale bar = 200 µm).
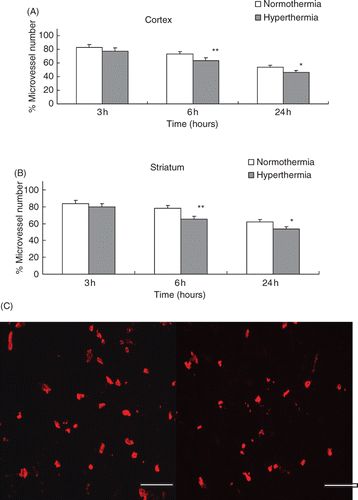
Figure 3. (A) The reduction of the number of collagen type IV positive stain microvessels in the cortex. The microvessel numbers are expressed as percentage changes between the ipsilateral and contralateral hemispheres to the occluded MCA. *p < 0.01, **p < 0.001 compared with the normothermic group. (B) Number of collagen type IV positive stain microvessels in the striatum. *p < 0.01, **p < 0.001 compared with the normothermic group. (C) Representative photomicrographs show microvessels stained by Cy™3-conjugated anti-type IV collagen at 24 h after MCA occlusion in the cortex. Left panel: normothermic and right panel: hyperthermic (scale bar = 200 µm).

Figure 4. (A) The reduction of the number of laminin positive stain microvessels in the cortex. The microvessel numbers are expressed as percentage changes between the ipsilateral and contralateral hemispheres to the occluded MCA. *p < 0.01, **p < 0.001 compared with the normothermic group. (B) Number of laminin positive stain microvessels in the striatum. *p < 0.01, **p < 0.001, compared with the normothermic group. (C) Representative photomicrographs show microvessels stained by FITC-conjugated anti-laminin at 24 h after MCA occlusion in the cortex. Left panel: normothermic, right panel: hyperthermic (scale bar = 200 µm).
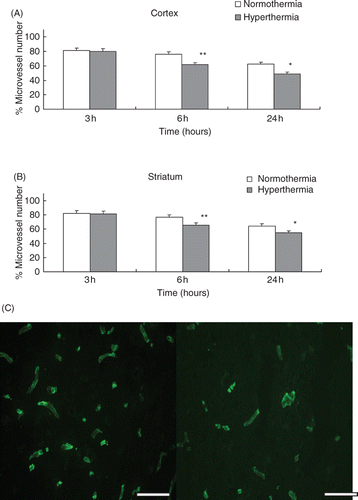
Figure 4. (A) The reduction of the number of laminin positive stain microvessels in the cortex. The microvessel numbers are expressed as percentage changes between the ipsilateral and contralateral hemispheres to the occluded MCA. *p < 0.01, **p < 0.001 compared with the normothermic group. (B) Number of laminin positive stain microvessels in the striatum. *p < 0.01, **p < 0.001, compared with the normothermic group. (C) Representative photomicrographs show microvessels stained by FITC-conjugated anti-laminin at 24 h after MCA occlusion in the cortex. Left panel: normothermic, right panel: hyperthermic (scale bar = 200 µm).

Figure 5. Gelatine zymogram shows the activities of MMP-2 (72 kDa) and MMP-9 (92 kDa) in the ischaemic injured brain collected from normothermic and hyperthermic rats. Lane 1: 3 h after normothermia; lane 2: 3 h after hyperthermia; lane 3: 6 h after normothermia; lane 4: 6 h after hyperthermia; lane 5: 24 h after normothermia; lane 6: 24 h after hyperthermia (A). Histograms show the densitometric analyses of MMP-2 (B) and MMP-9 (C) activities. *p < 0.05 compared with the normothermic group.
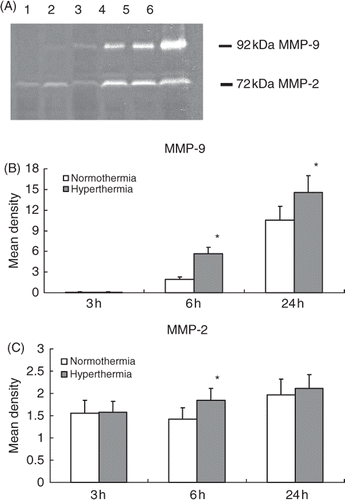
Figure 5. Gelatine zymogram shows the activities of MMP-2 (72 kDa) and MMP-9 (92 kDa) in the ischaemic injured brain collected from normothermic and hyperthermic rats. Lane 1: 3 h after normothermia; lane 2: 3 h after hyperthermia; lane 3: 6 h after normothermia; lane 4: 6 h after hyperthermia; lane 5: 24 h after normothermia; lane 6: 24 h after hyperthermia (A). Histograms show the densitometric analyses of MMP-2 (B) and MMP-9 (C) activities. *p < 0.05 compared with the normothermic group.

Figure 6. Casein/plasminogen zymogram shows the activities of uPA and tPA in the ischaemic injured brain collected from normothermic and hyperthermic rats. Lane 1: 3 h after normothermia; lane 2: 3 h after hyperthermia; lane 3: 6 h after normothermia; lane 4: 6 h after hyperthermia; lane 5: 24 h after normothermia; lane 6: 24 h after hyperthermia. The upper band with a molecular weight of 64 kD represents tPA and the lower band with molecular weight of 40 kD represents uPA (A). Histogram shows the pooled data of uPA activities in the infarcted brain tissue (B). *p < 0.05 compared with the normothermic group.
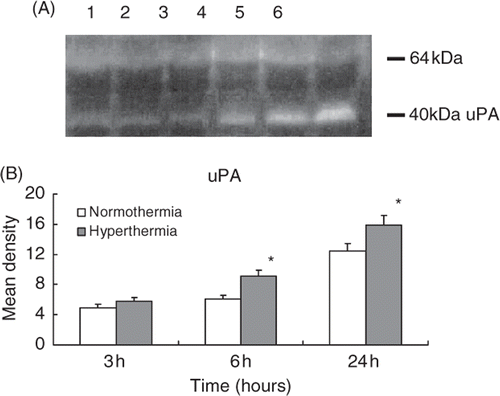
Figure 6. Casein/plasminogen zymogram shows the activities of uPA and tPA in the ischaemic injured brain collected from normothermic and hyperthermic rats. Lane 1: 3 h after normothermia; lane 2: 3 h after hyperthermia; lane 3: 6 h after normothermia; lane 4: 6 h after hyperthermia; lane 5: 24 h after normothermia; lane 6: 24 h after hyperthermia. The upper band with a molecular weight of 64 kD represents tPA and the lower band with molecular weight of 40 kD represents uPA (A). Histogram shows the pooled data of uPA activities in the infarcted brain tissue (B). *p < 0.05 compared with the normothermic group.

Reprints and Corporate Permissions

Please note: Selecting permissions does not provide access to the full text of the article, please see our help page How do I view content?

To request a reprint or corporate permissions for this article, please click on the relevant link below:

Academic Permissions

Please note: Selecting permissions does not provide access to the full text of the article, please see our help page How do I view content?

Obtain permissions instantly via Rightslink by clicking on the button below:

If you are unable to obtain permissions via Rightslink, please complete and submit this Permissions form. For more information, please visit our Permissions help page.