744
Views
13
CrossRef citations to date
0
Altmetric
Research Article

Arrhenius analysis of the relationship between hyperthermia and Hsp70 promoter activation: A comparison between ex vivo and in vivo data

, , , &
Pages 441-450 | Received 23 May 2011, Accepted 06 Mar 2012, Published online: 12 Jun 2012

Figures & data

Figure 1. Temperature profile in time measured with a fiber optic probe at three positions in mouse leg (intradermal, subcutaneously and intramuscular) during warm water bath heating at three different temperatures.
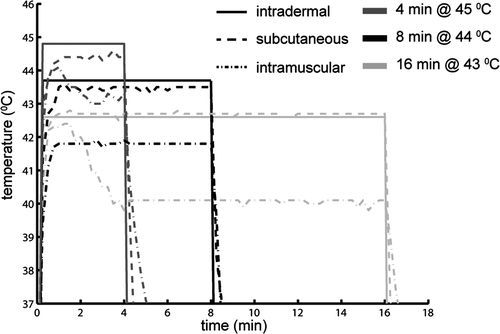
Figure 1. Temperature profile in time measured with a fiber optic probe at three positions in mouse leg (intradermal, subcutaneously and intramuscular) during warm water bath heating at three different temperatures.

Figure 2. Bioluminescence image taken 4 hours after heating the right leg of NLF-1 mouse in a water bath. The colors show the light intensity measured with an optical camera from low intensity (violet) to high intensity (red). The position of the ROI used for quantification of the bioluminescence signal is also indicated.

Figure 2. Bioluminescence image taken 4 hours after heating the right leg of NLF-1 mouse in a water bath. The colors show the light intensity measured with an optical camera from low intensity (violet) to high intensity (red). The position of the ROI used for quantification of the bioluminescence signal is also indicated.

Figure 3. Time course of luciferase activity after heating a mouse leg with different heating protocols (A) 4, 8 and 16 min at 43°C, (B) 2, 4 and 8 min at 44°C, and (C) 1, 2 and 4 min at 45°C. The signal intensity (SI) is the average light intensity measured in the ROI, which is indicated in figure 2. The control measurement is done at the same position in the non-heated leg of the mice that were heated for the longest duration at each temperature.

Figure 3. Time course of luciferase activity after heating a mouse leg with different heating protocols (A) 4, 8 and 16 min at 43°C, (B) 2, 4 and 8 min at 44°C, and (C) 1, 2 and 4 min at 45°C. The signal intensity (SI) is the average light intensity measured in the ROI, which is indicated in figure 2. The control measurement is done at the same position in the non-heated leg of the mice that were heated for the longest duration at each temperature.

Figure 4. Time course of luciferase activity after heating a mouse leg. The data from figure 3 are rearranged in such a way that the luciferase activity is shown for constant heating duration (4 min) at 3 different temperatures. The signal intensity (SI) is the average light intensity measured in the ROI, which is indicated in figure 2. The control measurement is done at the same position in the non-heated leg of the mice that were heated at 45°C.

Figure 4. Time course of luciferase activity after heating a mouse leg. The data from figure 3 are rearranged in such a way that the luciferase activity is shown for constant heating duration (4 min) at 3 different temperatures. The signal intensity (SI) is the average light intensity measured in the ROI, which is indicated in figure 2. The control measurement is done at the same position in the non-heated leg of the mice that were heated at 45°C.

Figure 5. Bioluminescence image taken 4 hours after heating the left leg of NLF-1 mice for 16 min at 43°C (A, C) or 4 min at 45°C (B, D) in a water bath. In figures C and D the skin is locally removed (see inserts) to show the signal coming from the muscle. The numbers in figure indicate the average signal intensity (counts per second) measured in the ROIs as indicated in the figures. The colors show the light intensity measured with an optical camera from low intensity (violet) to high intensity (red).

Figure 5. Bioluminescence image taken 4 hours after heating the left leg of NLF-1 mice for 16 min at 43°C (A, C) or 4 min at 45°C (B, D) in a water bath. In figures C and D the skin is locally removed (see inserts) to show the signal coming from the muscle. The numbers in figure indicate the average signal intensity (counts per second) measured in the ROIs as indicated in the figures. The colors show the light intensity measured with an optical camera from low intensity (violet) to high intensity (red).

Figure 6. Arrhenius plot for constant-temperature in vivo water bath experiments 4 hours after heating. The error bars represent the standard deviation of the averages for each temperature. The solid line is a linear fit with error weighting performed on three data points, corresponding to 43, 44 and 45°C.

Figure 6. Arrhenius plot for constant-temperature in vivo water bath experiments 4 hours after heating. The error bars represent the standard deviation of the averages for each temperature. The solid line is a linear fit with error weighting performed on three data points, corresponding to 43, 44 and 45°C.

Figure 7. Arrhenius plot for constant-temperature ex vivo hyperthermia experiments 5 hours after heating. The solid line is a linear fit with error weighting performed on three data points, corresponding to 43, 44 and 45°C for the MEF. The dashed line is a linear fit with error weighting performed on three data points for BMM cells. The error bars represent the standard deviation of the averages for each temperature.

Figure 7. Arrhenius plot for constant-temperature ex vivo hyperthermia experiments 5 hours after heating. The solid line is a linear fit with error weighting performed on three data points, corresponding to 43, 44 and 45°C for the MEF. The dashed line is a linear fit with error weighting performed on three data points for BMM cells. The error bars represent the standard deviation of the averages for each temperature.

Reprints and Corporate Permissions

Please note: Selecting permissions does not provide access to the full text of the article, please see our help page How do I view content?

To request a reprint or corporate permissions for this article, please click on the relevant link below:

Academic Permissions

Please note: Selecting permissions does not provide access to the full text of the article, please see our help page How do I view content?

Obtain permissions instantly via Rightslink by clicking on the button below:

If you are unable to obtain permissions via Rightslink, please complete and submit this Permissions form. For more information, please visit our Permissions help page.