683
Views
9
CrossRef citations to date
0
Altmetric
Research Article

Combination therapy of radiofrequency ablation and bevacizumab monitored with power Doppler ultrasound in a murine model of hepatocellular carcinoma

, , , , , & show all
Pages 766-775 | Received 10 Jul 2012, Accepted 21 Aug 2012, Published online: 08 Oct 2012

Figures & data

Figure 1. Power Doppler ultrasound images of tumours treated with saline (control) and bevacizumab at 0 h, 2 days, and 7 days after administration. Representative images are shown at a similar location for the same tumour with B-mode images (greyscale) overlaid with power Doppler (red). Doppler signal above an arbitrary threshold is only shown for clarity. Power Doppler images represent a relative tumour blood flow.
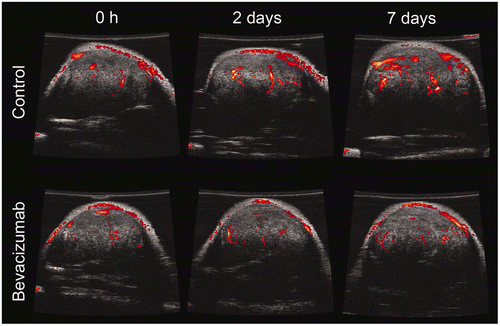
Figure 1. Power Doppler ultrasound images of tumours treated with saline (control) and bevacizumab at 0 h, 2 days, and 7 days after administration. Representative images are shown at a similar location for the same tumour with B-mode images (greyscale) overlaid with power Doppler (red). Doppler signal above an arbitrary threshold is only shown for clarity. Power Doppler images represent a relative tumour blood flow.

Figure 2. Colour-weighted fractional area (CWFA) indicating relative tumour blood flow for control and bevacizumab-treated animals over 1 week. Animals were treated with saline (control) or bevacizumab at day 0 and all data were normalised by the day 0 value. CWFA approximates tumour blood flow. Data are shown as mean ± SEM (n = 5–6) and * indicates P value < 0.05.
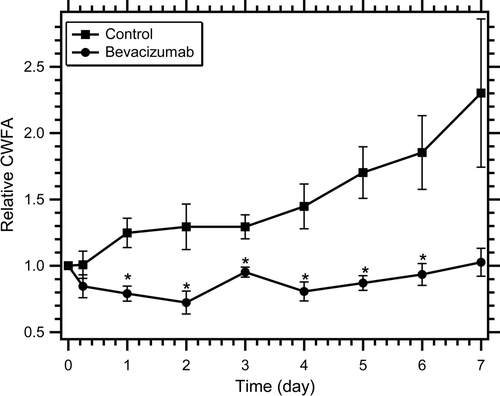
Figure 2. Colour-weighted fractional area (CWFA) indicating relative tumour blood flow for control and bevacizumab-treated animals over 1 week. Animals were treated with saline (control) or bevacizumab at day 0 and all data were normalised by the day 0 value. CWFA approximates tumour blood flow. Data are shown as mean ± SEM (n = 5–6) and * indicates P value < 0.05.

Figure 3. Microvascular analysis of control and bevacizumab-treated tumours. Top row: Whole tumour sections with CD31 immunohistochemistry identifying endothelial cells (red) and DAPI indicating tumour nuclei (blue). Middle row: Higher magnification images of tumour sections shown in the top row. Bottom row: Distance maps indicating the distance between a tumour cell and the nearest vascular surface. Large distances (up to 200 µm) are shown in red while short distances are shown in blue. Bar is 2 mm for top and bottom row and 200 µm for middle row.
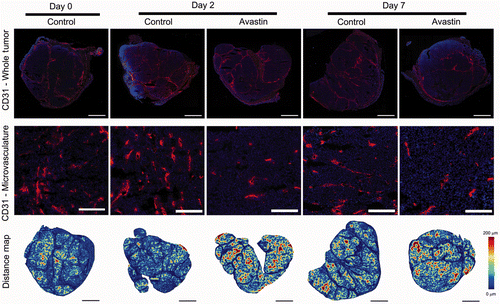
Figure 3. Microvascular analysis of control and bevacizumab-treated tumours. Top row: Whole tumour sections with CD31 immunohistochemistry identifying endothelial cells (red) and DAPI indicating tumour nuclei (blue). Middle row: Higher magnification images of tumour sections shown in the top row. Bottom row: Distance maps indicating the distance between a tumour cell and the nearest vascular surface. Large distances (up to 200 µm) are shown in red while short distances are shown in blue. Bar is 2 mm for top and bottom row and 200 µm for middle row.

Figure 4. Microvascular density (A) and median distance from a tumour cell to the nearest vascular surface (B) calculated from whole tumour sections for control and bevacizumab-treated tumours. Data are shown as mean ± SEM (n = 4–5) and * indicates P value < 0.05 versus control on the same day.
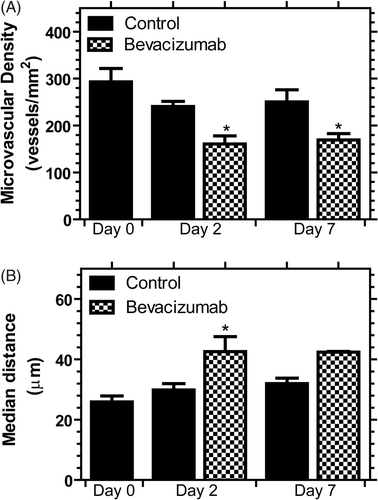
Figure 4. Microvascular density (A) and median distance from a tumour cell to the nearest vascular surface (B) calculated from whole tumour sections for control and bevacizumab-treated tumours. Data are shown as mean ± SEM (n = 4–5) and * indicates P value < 0.05 versus control on the same day.

Figure 5. Viability and H&E stain of control and bevacizumab-treated animals after RF ablation on day 2 of treatment. The tumours stained for viability (NBT tetrazolium) indicate viable regions with a blue colour and dead tissue appears clear. Bar is 5 mm.
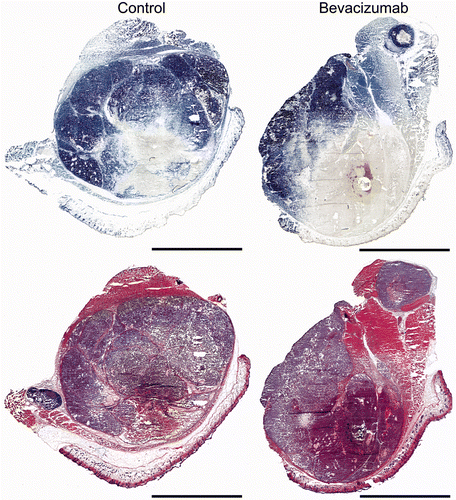
Figure 5. Viability and H&E stain of control and bevacizumab-treated animals after RF ablation on day 2 of treatment. The tumours stained for viability (NBT tetrazolium) indicate viable regions with a blue colour and dead tissue appears clear. Bar is 5 mm.

Figure 6. Ablation diameter for control and bevacizumab-treated animals. Ablation diameter was increased 14% for bevacizumab treatment. Data are shown as a scatter plot with the mean indicated as a line (n = 5–7). P value = 0.1909.
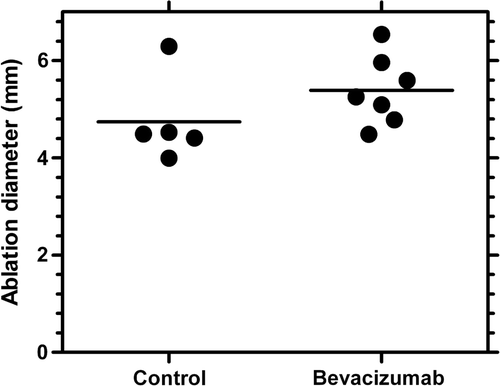
Figure 6. Ablation diameter for control and bevacizumab-treated animals. Ablation diameter was increased 14% for bevacizumab treatment. Data are shown as a scatter plot with the mean indicated as a line (n = 5–7). P value = 0.1909.

Figure 7. Computational modelling of ablation diameter (A), and percentage change in ablation diameter (B) for a 5-mm and 3-cm active tip electrode. The ablation was performed for 50 s for the 5-mm active tip (similar to in vivo protocol) and for 12 min for the 3-cm active tip (similar to routine clinical practice).
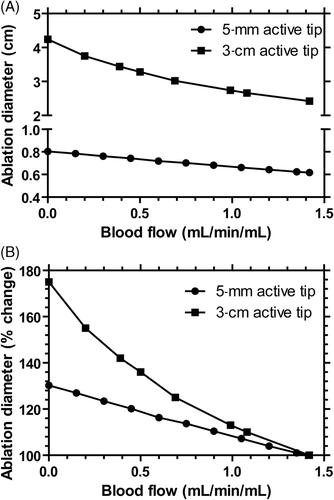
Figure 7. Computational modelling of ablation diameter (A), and percentage change in ablation diameter (B) for a 5-mm and 3-cm active tip electrode. The ablation was performed for 50 s for the 5-mm active tip (similar to in vivo protocol) and for 12 min for the 3-cm active tip (similar to routine clinical practice).

Reprints and Corporate Permissions

Please note: Selecting permissions does not provide access to the full text of the article, please see our help page How do I view content?

To request a reprint or corporate permissions for this article, please click on the relevant link below:

Academic Permissions

Please note: Selecting permissions does not provide access to the full text of the article, please see our help page How do I view content?

Obtain permissions instantly via Rightslink by clicking on the button below:

If you are unable to obtain permissions via Rightslink, please complete and submit this Permissions form. For more information, please visit our Permissions help page.