Figures & data
Table 1. Primers used for PCR.
Figure 1. Photomicrographs of H&E-stained sections of rat jejunum, duodenum, and ileum on day 3 (200 × magnification); top row, control group; lower row, heat-stress group (A, D, duodenum; B, E, jejunum; C, F, ileum). Villi of the duodenum, jejunum, and ileum in the heat-stress rats were all damaged, especially in the jejunum. Scale bar represents 100 µm. Arrows represent damage to the mucosal epithelial cells.
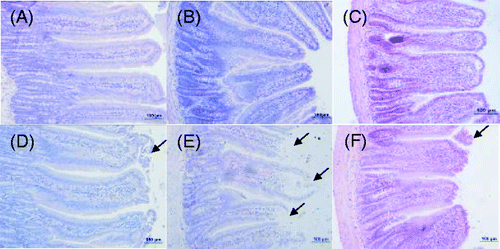
Figure 2. Ultrastructure examination of rat jejunal epithelium on day 3; top row, control group; lower row, heat-stress group (A1, B1, 1500 × magnification; A2, B2, 5000 × magnification). Abnormal microstructure was found after heat stress. A large amount of inflamed fibrous substances flowed out, tight junctions between epithelial cells became obscure, and intercellular spaces were loosened.
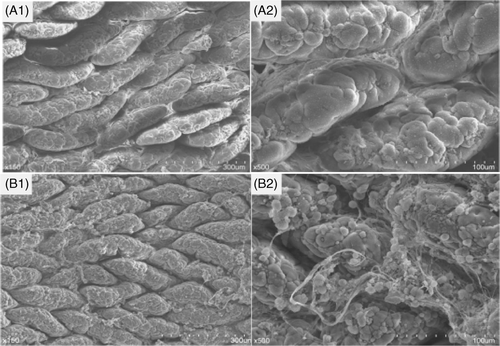
Figure 3. Photomicrographs of PAS-stained sections of rat jejunum, duodenum and ileum on day 3 (200 × magnification). Heat stress significantly decreased the numbers of the goblet cells in the duodenum and jejunum, but significantly increased the number of goblet cells in the ileum. Scale bar represents 100 µm.
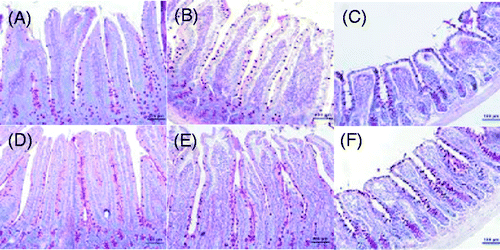
Figure 4. Expressions of TLR2, TLR4, and sIgA related to mucosal immunity were determined by western blotting. Heat stress significantly decreased the expression of TLR2, TLR4 and sIgA. Values represent the mean ± SE, n = 6 for each group. *p < 0.05 for the heat-stress versus control group.
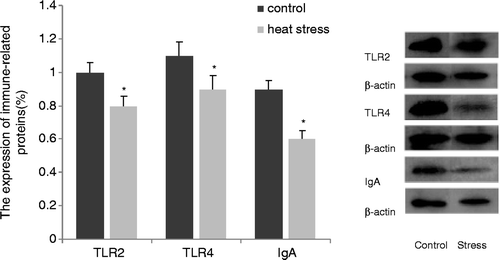
Figure 5. Relative mRNA expression of intestinal typical Th1/Th2 cytokines in rat ileum mucosa. Analysis was performed using real-time PCR. Values represent the mean ± SE, n = 6 rats for each group. *p < 0.05 for the heat-stress versus control group.
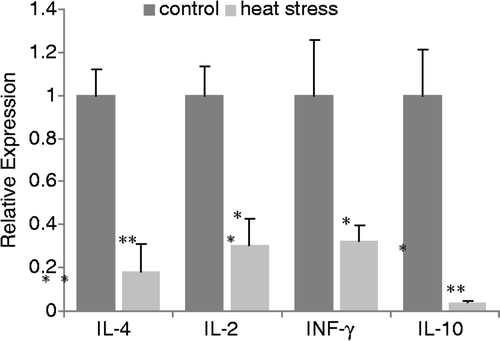
Figure 6. Flow cytometry diagrams of quantitative changes of lymphocytes in the MLNs on day 3 after heat stress. Top row, control group; lower row, heat-stress group. A and C represent the numbers of CD3+ T cells in the MLNs. B and D represent the percentages of T-cell sub-populations, top left section represent CD3+CD4+CD8− Th cells and low right section represent CD3+CD4-CD8+ Tc cells.
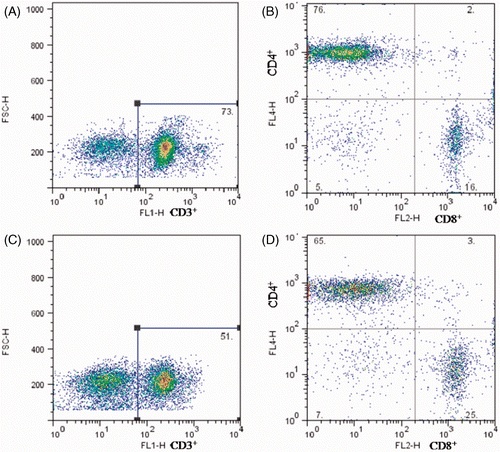
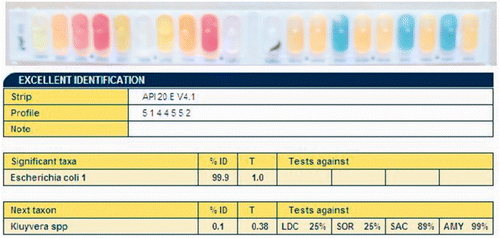
Figure 7. Bacterial biochemical tests were performed by an API 20E kit, and positive or negative results as judged by colour were input into the API web software system and analysed, which revealed that all the characteristics were 99% specific to Escherichia coli.