1,055
Views
15
CrossRef citations to date
0
Altmetric
Research Article

Whole-body hyperthermia combined with hyperthermic intraperitoneal chemotherapy for the treatment of stage IV advanced gastric cancer

, &
Pages 735-741 | Received 25 Sep 2012, Accepted 25 Sep 2012, Published online: 01 Nov 2012

Figures & data

Table 1.  Clinical data.

Figure 1. Treatment effect assessment. In the treatment group, the number of CR + PR was 16, the complete and partial remission rate of patients was 61.5%, and the stable rate was 19.2%. However, in the control group, the number of CR + PR was 5, the complete and partial remission rate of patients was 23.8%, and the stable disease rate was 28.5%. All data were tested using χ2, χ2 = 8.04, P = 0.045. According to the level α = 0.05, there was a significant difference between the two groups. Notes: Complete Response (CR): disappearance of all target lesions. Partial Response (PR): at least a 30% decrease in the sum of LD of target lesions. Progressive Disease (PD): at least a 20% increase in the sum of LD of target lesions or the appearance of one or more new lesions. Stable Disease (SD): neither sufficient shrinkage to qualify for PR nor sufficient increase.
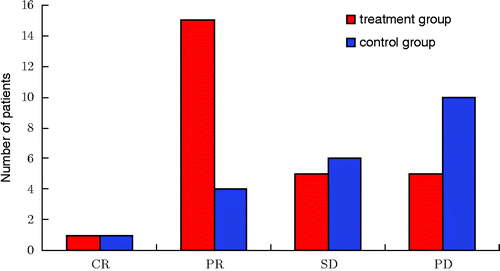
Figure 1. Treatment effect assessment. In the treatment group, the number of CR + PR was 16, the complete and partial remission rate of patients was 61.5%, and the stable rate was 19.2%. However, in the control group, the number of CR + PR was 5, the complete and partial remission rate of patients was 23.8%, and the stable disease rate was 28.5%. All data were tested using χ2, χ2 = 8.04, P = 0.045. According to the level α = 0.05, there was a significant difference between the two groups. Notes: Complete Response (CR): disappearance of all target lesions. Partial Response (PR): at least a 30% decrease in the sum of LD of target lesions. Progressive Disease (PD): at least a 20% increase in the sum of LD of target lesions or the appearance of one or more new lesions. Stable Disease (SD): neither sufficient shrinkage to qualify for PR nor sufficient increase.

Table 2.  Treatment effect assessment.

Figure 2. Karnofsky score. As the histogram above shows, whole-body hyperthermia combined with hyperthermic intraperitoneal chemo-perfusion in the treatment group increased Karnofsky scores.
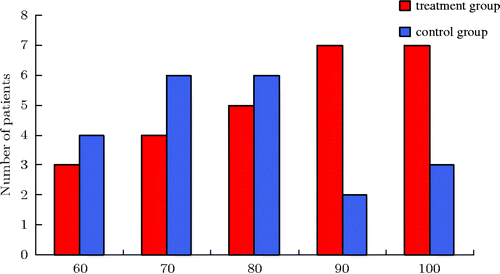
Figure 2. Karnofsky score. As the histogram above shows, whole-body hyperthermia combined with hyperthermic intraperitoneal chemo-perfusion in the treatment group increased Karnofsky scores.

Table 3.  Karnofsky score.

Figure 3. Treatment effect assessment. Primary focus: in the treatment group, the complete and partial remission rate of patients was 50%, while the rate in the control group was 33%. All data were tested using χ2, χ2 = 1.69, P = 0.43. According to the level α = 0.05, there is no significant difference between the two groups. Hepatic metastases: in the treatment group the complete and partial remission rate of patients was 66.7%, while the rate in the control group was 28.6%. All data were tested using χ2, χ2 = 5.25, P = 0.023. According to the level α = 0.05, there is significant difference between the two groups. Lymph node: in the treatment group, the complete and partial remission rate of patients was 57.7%, while the rate in the control group was 42.1%. All data were tested using χ2, χ2 = 1.28, P = 0.53. According to the level α = 0.05, there is no significant difference between the two groups. Ascites: the complete and partial remission rate of patients was 70.6%, while the rate in the control group was 33.3%. All data were tested using χ2, χ2 = 6.89, P = 0.017. According to the level α = 0.05, there is a significant difference between the two groups. Notes: Complete Response (CR): disappearance of all target lesions. Partial Response (PR): at least a 30% decrease in the sum of LD of target lesions. Progressive Disease (PD): at least a 20% increase in the sum of LD of target lesions or the appearance of one or more new lesions. Stable Disease (SD): neither sufficient shrinkage to qualify for PR nor sufficient increase.
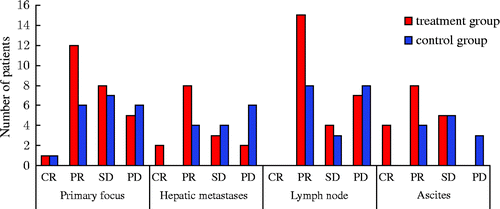
Figure 3. Treatment effect assessment. Primary focus: in the treatment group, the complete and partial remission rate of patients was 50%, while the rate in the control group was 33%. All data were tested using χ2, χ2 = 1.69, P = 0.43. According to the level α = 0.05, there is no significant difference between the two groups. Hepatic metastases: in the treatment group the complete and partial remission rate of patients was 66.7%, while the rate in the control group was 28.6%. All data were tested using χ2, χ2 = 5.25, P = 0.023. According to the level α = 0.05, there is significant difference between the two groups. Lymph node: in the treatment group, the complete and partial remission rate of patients was 57.7%, while the rate in the control group was 42.1%. All data were tested using χ2, χ2 = 1.28, P = 0.53. According to the level α = 0.05, there is no significant difference between the two groups. Ascites: the complete and partial remission rate of patients was 70.6%, while the rate in the control group was 33.3%. All data were tested using χ2, χ2 = 6.89, P = 0.017. According to the level α = 0.05, there is a significant difference between the two groups. Notes: Complete Response (CR): disappearance of all target lesions. Partial Response (PR): at least a 30% decrease in the sum of LD of target lesions. Progressive Disease (PD): at least a 20% increase in the sum of LD of target lesions or the appearance of one or more new lesions. Stable Disease (SD): neither sufficient shrinkage to qualify for PR nor sufficient increase.

Table 4.  Assessment of therapeutic efficacy.

Figure 4. Survival time. In the treatment group, the 6-month survival rate was 69.2%, and the 1-year survival rate was 38.5%. In the control group, the 6-month survival rate was 66.7%, and the 1-year survival rate was 19%. Tested using the log-rank test, χ2 = 1.32, P = 0.25. According to the level α = 0.05, there is no significant difference between the two groups.
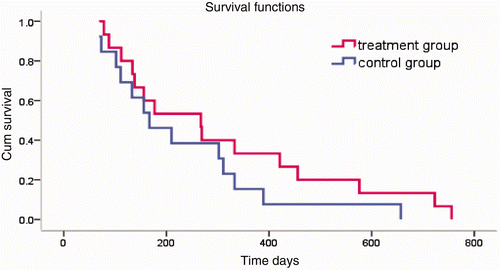
Figure 4. Survival time. In the treatment group, the 6-month survival rate was 69.2%, and the 1-year survival rate was 38.5%. In the control group, the 6-month survival rate was 66.7%, and the 1-year survival rate was 19%. Tested using the log-rank test, χ2 = 1.32, P = 0.25. According to the level α = 0.05, there is no significant difference between the two groups.

Reprints and Corporate Permissions

Please note: Selecting permissions does not provide access to the full text of the article, please see our help page How do I view content?

To request a reprint or corporate permissions for this article, please click on the relevant link below:

Academic Permissions

Please note: Selecting permissions does not provide access to the full text of the article, please see our help page How do I view content?

Obtain permissions instantly via Rightslink by clicking on the button below:

If you are unable to obtain permissions via Rightslink, please complete and submit this Permissions form. For more information, please visit our Permissions help page.