771
Views
14
CrossRef citations to date
0
Altmetric
Research Article

HIFU treatment time reduction through heating approach optimisation

, &
Pages 799-820 | Received 30 Mar 2012, Accepted 08 Oct 2012, Published online: 16 Nov 2012

Figures & data

Figure 1. Model used for axial focal zone spacing and packing optimisation studies. The simulation region (left) and a close-up (right) of an “axial tumour” are shown. The black dot at the centre of the tumour (right) marks the location of both the centre of the tumour and the geometric focus of the transducer. Both axial tumours (1.6 and 3.0 cm long) had at least 2.0 cm (slightly more for the smaller tumour) of normal tissue between the skin/water interface and the proximal tumour face to allow for a significant space in which normal tissue heating could occur.
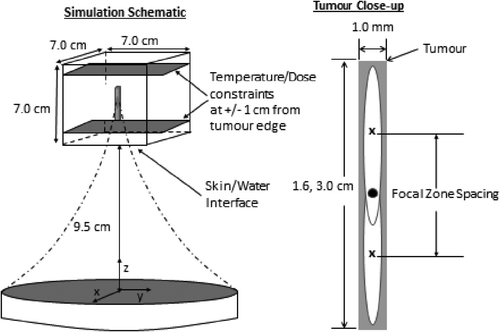
Figure 1. Model used for axial focal zone spacing and packing optimisation studies. The simulation region (left) and a close-up (right) of an “axial tumour” are shown. The black dot at the centre of the tumour (right) marks the location of both the centre of the tumour and the geometric focus of the transducer. Both axial tumours (1.6 and 3.0 cm long) had at least 2.0 cm (slightly more for the smaller tumour) of normal tissue between the skin/water interface and the proximal tumour face to allow for a significant space in which normal tissue heating could occur.

Table I.  Tissue and acoustic properties held constant in all simulations except for the changing absorptivity study.

Figure 2. Schematic of treatments on the axial tumour using two, three, four and 17 positions. The black dot at the centre shows the tumour centre and the location of the geometric focus of the transducer. The arrows show the distances used to define the focal zone spacing for every treatment. All focal zones were equally spaced within any given treatment.
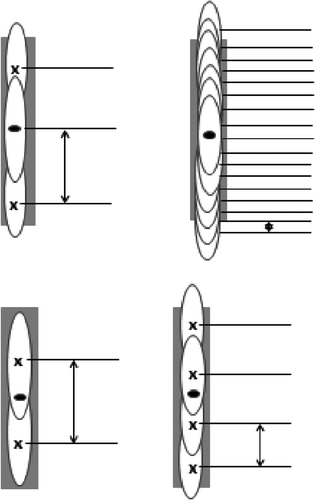
Figure 2. Schematic of treatments on the axial tumour using two, three, four and 17 positions. The black dot at the centre shows the tumour centre and the location of the geometric focus of the transducer. The arrows show the distances used to define the focal zone spacing for every treatment. All focal zones were equally spaced within any given treatment.

Figure 3. Schematic of the four-position transverse spacing study using two axial stacks of two positions each. The black dot at the centre of each axial stack of focal zones coincides with the geometric centre of the transducer. The axial spacing between focal zones in each stack was fixed at the optimal value found for the two-position treatment of a single axial stack. The shaded area between the stacks shows the inter-axial tumour volume (left) where the dose is guaranteed to reach the target dose (CEM240) by the end of the treatment. This ‘control volume’ is smaller than the ‘total volume ablated’ by the treatment (right) because thermal dose is also deposited exterior to the inter-axial tumour space.
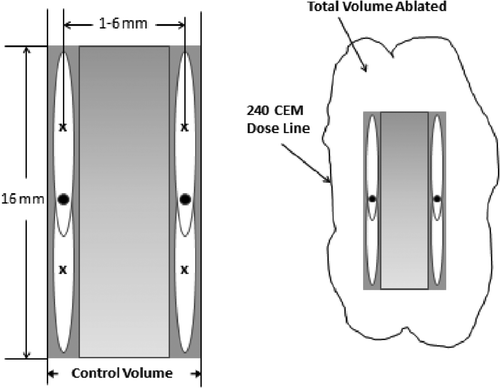
Figure 3. Schematic of the four-position transverse spacing study using two axial stacks of two positions each. The black dot at the centre of each axial stack of focal zones coincides with the geometric centre of the transducer. The axial spacing between focal zones in each stack was fixed at the optimal value found for the two-position treatment of a single axial stack. The shaded area between the stacks shows the inter-axial tumour volume (left) where the dose is guaranteed to reach the target dose (CEM240) by the end of the treatment. This ‘control volume’ is smaller than the ‘total volume ablated’ by the treatment (right) because thermal dose is also deposited exterior to the inter-axial tumour space.

Figure 4. (a) Total heating time versus axial separation of the centres of two focal zones (NFZL = 2) heating the smaller axial tumour using a front–back scan path with the focal zones located symmetrically around the tumour centre. Zero separation indicates complete overlap of the two focal zones (i.e. it is equivalent to using only one focal zone). Results are shown using collective optimisation for both the concentrated heating approach (circles) and the high velocity fractionated heating approach (diamonds). The percentage of the optimised times spent in the front/back locations are shown for all separations. Also shown (at 8 mm) are the total heating times (×) for a fully optimised, fractionated scan for NCYCLES = 2 in which four times were optimised, and for a concentrated scan using sequential optimisation (solid square) whose optimised front/back heating times were similar to the fully optimised times. (b) Thermal dose versus distance from the front of the tumour for the treatments of the small axial tumour using 2 mm (diamonds), 8 mm (squares), and 16 mm (stars) separations with the concentrated heating approach and collective optimisation.
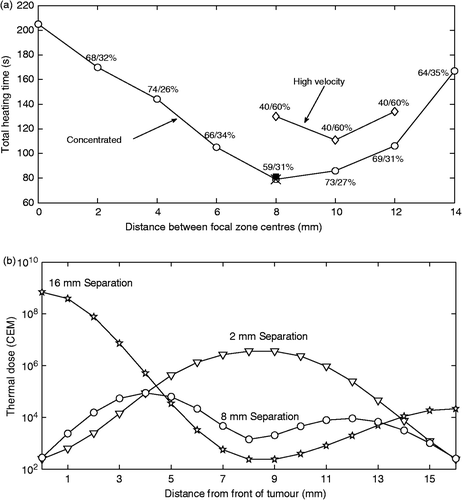
Figure 4. (a) Total heating time versus axial separation of the centres of two focal zones (NFZL = 2) heating the smaller axial tumour using a front–back scan path with the focal zones located symmetrically around the tumour centre. Zero separation indicates complete overlap of the two focal zones (i.e. it is equivalent to using only one focal zone). Results are shown using collective optimisation for both the concentrated heating approach (circles) and the high velocity fractionated heating approach (diamonds). The percentage of the optimised times spent in the front/back locations are shown for all separations. Also shown (at 8 mm) are the total heating times (×) for a fully optimised, fractionated scan for NCYCLES = 2 in which four times were optimised, and for a concentrated scan using sequential optimisation (solid square) whose optimised front/back heating times were similar to the fully optimised times. (b) Thermal dose versus distance from the front of the tumour for the treatments of the small axial tumour using 2 mm (diamonds), 8 mm (squares), and 16 mm (stars) separations with the concentrated heating approach and collective optimisation.

Figure 5. Treatment time versus distance of the proximal and distal focal zones from the tumour centre in a three-position, middle/front/back treatment of the smaller axial tumour for the concentrated heating approach using the collective (open circles) and sequential (solid squares) optimisation techniques. The percentage of time spent in the middle/front/back focal zone locations is shown for the collective optimisation technique. Also shown at the optimal spacing are the result for the fully optimised fractionated heating approach (×) with two cycles (NCYCLES = 2, for which six times were optimised) and for the high velocity, collectively optimised fractionated scan (diamond), i.e. the single, larger effective focal zone case.
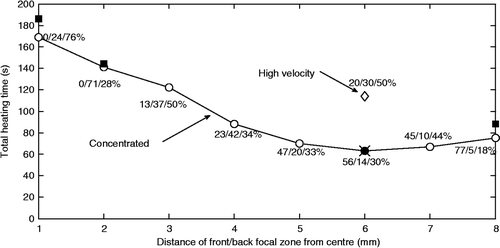
Figure 5. Treatment time versus distance of the proximal and distal focal zones from the tumour centre in a three-position, middle/front/back treatment of the smaller axial tumour for the concentrated heating approach using the collective (open circles) and sequential (solid squares) optimisation techniques. The percentage of time spent in the middle/front/back focal zone locations is shown for the collective optimisation technique. Also shown at the optimal spacing are the result for the fully optimised fractionated heating approach (×) with two cycles (NCYCLES = 2, for which six times were optimised) and for the high velocity, collectively optimised fractionated scan (diamond), i.e. the single, larger effective focal zone case.

Figure 6. Treatment time versus middle position duty cycle for a high velocity, three-position treatment of the small axial tumour using the optimal spacing of . The duty cycle percentage spent at the back focal zone position is shown above each line, while the front position percentages can be obtained by subtraction.
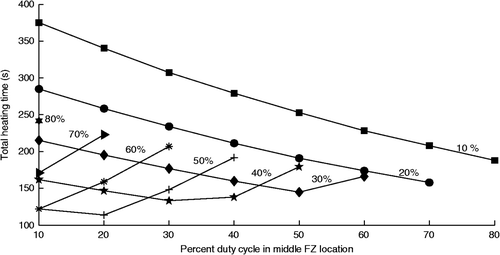
Figure 6. Treatment time versus middle position duty cycle for a high velocity, three-position treatment of the small axial tumour using the optimal spacing of Figure 5. The duty cycle percentage spent at the back focal zone position is shown above each line, while the front position percentages can be obtained by subtraction.

Figure 7. Treatment time versus the number of focal zone locations for concentrated heating using the collective optimisation technique (circles) and for the high velocity, fractionated approach that creates a single, large effective focal zone (diamonds). Results are shown for both the smaller and larger axial tumours. Results are also shown for the 17-position case for the concentrated treatment of the smaller axial tumour using sequential optimisation (filled square).
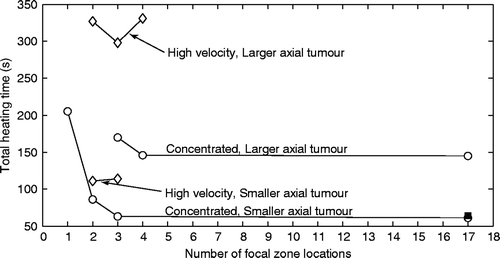
Figure 7. Treatment time versus the number of focal zone locations for concentrated heating using the collective optimisation technique (circles) and for the high velocity, fractionated approach that creates a single, large effective focal zone (diamonds). Results are shown for both the smaller and larger axial tumours. Results are also shown for the 17-position case for the concentrated treatment of the smaller axial tumour using sequential optimisation (filled square).

Figure 8. Heating time at each position versus distance from the front tumour face for the 17-position treatment of the smaller axial tumour using a middle/front–/back treatment path and the concentrated heating approach. Results are shown for both the collectively optimised (top) and sequentially optimised (bottom) techniques. The number by each data point indicates the relative order in which that focal zone location was heated.
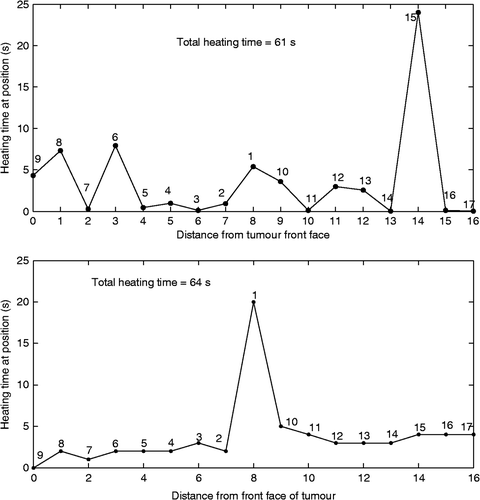
Figure 8. Heating time at each position versus distance from the front tumour face for the 17-position treatment of the smaller axial tumour using a middle/front–/back treatment path and the concentrated heating approach. Results are shown for both the collectively optimised (top) and sequentially optimised (bottom) techniques. The number by each data point indicates the relative order in which that focal zone location was heated.

Figure 9. (a) Ablation rate in the control volume (the voxels in the control volume as defined in ) versus centreline separation for two side-by-side, two-position axial stacks for the collectively optimised, concentrated heating approach (open circles) and the optimised high velocity fractionated heating approach with a uniform duty cycle of 25% at each position (diamonds). The percentage of time spent at each of the four positions (front/back for stack 1 then front/back for stack 2) is shown for the concentrated heating approach. The axial spacing between focal zones in each axial stack was 10 mm. The cross (× at 3 mm) shows the result for the fully optimised, fractionated case with two cycles (and hence eight pulse heating times) which reduced to the concentrated heating times plus four zero heating times. Also shown is the result for the sequential optimisation of the concentrated heating approach at the optimal spacing (filled square). The vertical lines indicate the spacing at which each treatment approach first violated the normal tissue constraints, with the arrow indicating that all larger spacings also violated the safety constraint. (b and c) Dose maps of treatments using two adjacent axial stacks (of two positions each) for spacings between the centres of the two stacks of 1–6 mm for the collectively optimised, concentrated focal zones (b) and the high velocity fractionated heating (c). The interior and exterior dose lines for each map are the 240 and 30 CEM lines respectively. The slice contains the two stacks’ axes. Dimensions are in mm. (d) The ablation rate for the total volume (control volume + exterior voxels) treated using two axial stacks with four positions each with all parameters identical to those listed in for treatments using concentrated heating (open circles) and high velocity fractionated (closed circles) heating. The spacings where the normal tissue and dose constraint are first violated are indicated by arrows.
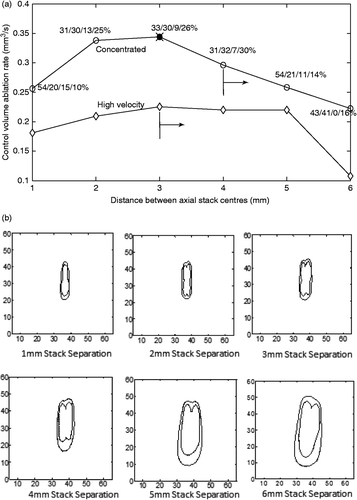
Figure 9. (a) Ablation rate in the control volume (the voxels in the control volume as defined in Figure 3) versus centreline separation for two side-by-side, two-position axial stacks for the collectively optimised, concentrated heating approach (open circles) and the optimised high velocity fractionated heating approach with a uniform duty cycle of 25% at each position (diamonds). The percentage of time spent at each of the four positions (front/back for stack 1 then front/back for stack 2) is shown for the concentrated heating approach. The axial spacing between focal zones in each axial stack was 10 mm. The cross (× at 3 mm) shows the result for the fully optimised, fractionated case with two cycles (and hence eight pulse heating times) which reduced to the concentrated heating times plus four zero heating times. Also shown is the result for the sequential optimisation of the concentrated heating approach at the optimal spacing (filled square). The vertical lines indicate the spacing at which each treatment approach first violated the normal tissue constraints, with the arrow indicating that all larger spacings also violated the safety constraint. (b and c) Dose maps of treatments using two adjacent axial stacks (of two positions each) for spacings between the centres of the two stacks of 1–6 mm for the collectively optimised, concentrated focal zones (b) and the high velocity fractionated heating (c). The interior and exterior dose lines for each map are the 240 and 30 CEM lines respectively. The slice contains the two stacks’ axes. Dimensions are in mm. (d) The ablation rate for the total volume (control volume + exterior voxels) treated using two axial stacks with four positions each with all parameters identical to those listed in Figure 9A for treatments using concentrated heating (open circles) and high velocity fractionated (closed circles) heating. The spacings where the normal tissue and dose constraint are first violated are indicated by arrows.

Figure 10. Heating time versus scanning approach for six different treatments on a square treatment region with transducer and tissue parameters matched to data from an agar phantom. The diamonds show the results of the fractionated heating approach with different fixed heating times per pulse. The circles show the concentrated approach results for a fixed (non-optimised) heating time per pulse and a collectively optimised scan, while the solid square shows the sequential optimisation result.
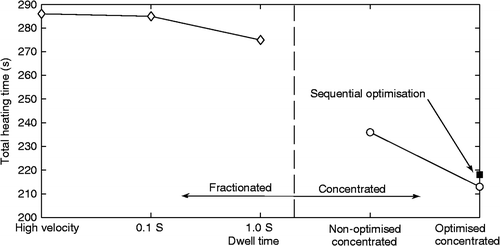
Figure 10. Heating time versus scanning approach for six different treatments on a square treatment region with transducer and tissue parameters matched to data from an agar phantom. The diamonds show the results of the fractionated heating approach with different fixed heating times per pulse. The circles show the concentrated approach results for a fixed (non-optimised) heating time per pulse and a collectively optimised scan, while the solid square shows the sequential optimisation result.

Figure 11. Collectively optimised concentrated heating approach heating times versus treatment path sequence for the smaller axial tumour using three positions with normal absorptivity (circles) immediately doubled absorptivity (triangles) and immediately quadrupled absorptivity (stars). Spacing between focal zones is the optimal value found in the three-position axial spacing study. The abbreviations F, M, and B are used for the front, middle, and back treatment focal zone locations, respectively, and the order in which the letters appear is the order in which the focal zones were heated.
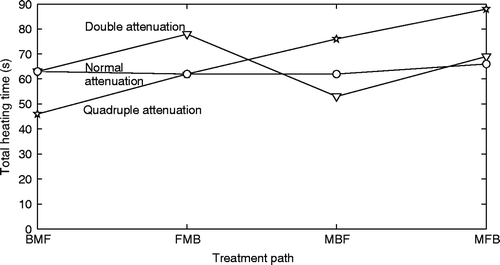
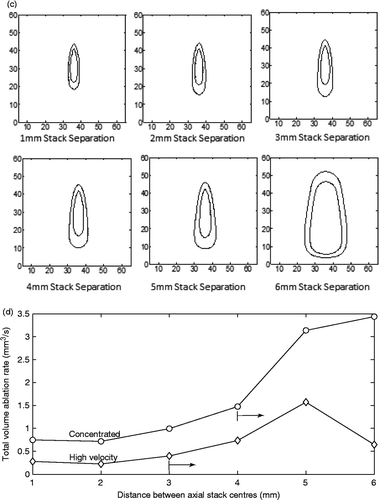
Figure 11. Collectively optimised concentrated heating approach heating times versus treatment path sequence for the smaller axial tumour using three positions with normal absorptivity (circles) immediately doubled absorptivity (triangles) and immediately quadrupled absorptivity (stars). Spacing between focal zones is the optimal value found in the three-position axial spacing study. The abbreviations F, M, and B are used for the front, middle, and back treatment focal zone locations, respectively, and the order in which the letters appear is the order in which the focal zones were heated.

Reprints and Corporate Permissions

Please note: Selecting permissions does not provide access to the full text of the article, please see our help page How do I view content?

To request a reprint or corporate permissions for this article, please click on the relevant link below:

Academic Permissions

Please note: Selecting permissions does not provide access to the full text of the article, please see our help page How do I view content?

Obtain permissions instantly via Rightslink by clicking on the button below:

If you are unable to obtain permissions via Rightslink, please complete and submit this Permissions form. For more information, please visit our Permissions help page.