704
Views
7
CrossRef citations to date
0
Altmetric
Research Article

Heat-inducible transgene expression with transcriptional amplification mediated by a transactivator

, , , &
Pages 788-798 | Received 11 May 2012, Accepted 08 Oct 2012, Published online: 16 Nov 2012

Figures & data

Figure 1. Construction of the transgene expression unit. (A) Transactivator expression plasmid. (B) Reporter gene expression plasmids. (C) Therapeutic gene expression plasmids.
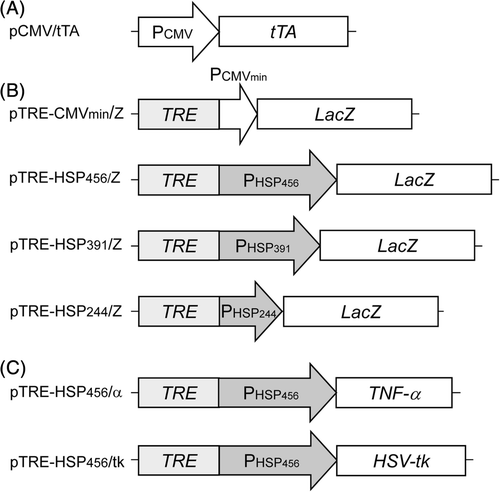
Figure 1. Construction of the transgene expression unit. (A) Transactivator expression plasmid. (B) Reporter gene expression plasmids. (C) Therapeutic gene expression plasmids.

Figure 2. Schematic of the strategy for heat-inducible gene expression of TRE-HSP hybrid promoter. (A) Mechanism of action in non-heated cells. We hypothesise that the following sequence of events occurs: (1) tTA is constitutively expressed under CMV promoter; (2) tTA can bind to the TRE within the TRE-HSP hybrid promoter upstream of a therapeutic gene; (3) but the therapeutic gene cannot be induced because the hsp70B′ promoter is not induced in non-heated cells. (B) Mechanism of action in heated cells. In this case, HSF is activated and translocates to the cell nucleus, where it binds to the HSE, and the hsp70B′ promoter drives the therapeutic gene. Once the hsp70B′ promoter is activated, the tTA potentially activates transcription of the therapeutic gene, thus leading to transcriptional amplification of the TRE-HSP hybrid promoter mediated by tTA.
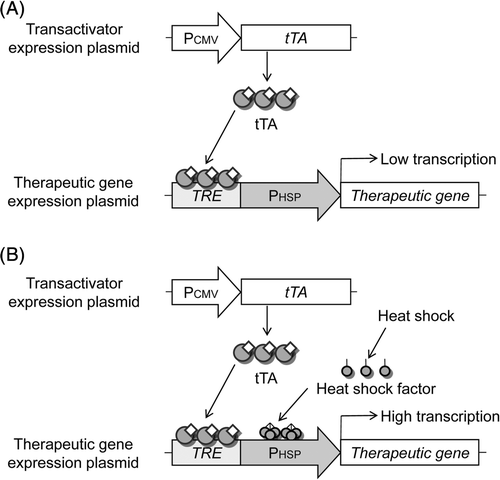
Figure 2. Schematic of the strategy for heat-inducible gene expression of TRE-HSP hybrid promoter. (A) Mechanism of action in non-heated cells. We hypothesise that the following sequence of events occurs: (1) tTA is constitutively expressed under CMV promoter; (2) tTA can bind to the TRE within the TRE-HSP hybrid promoter upstream of a therapeutic gene; (3) but the therapeutic gene cannot be induced because the hsp70B′ promoter is not induced in non-heated cells. (B) Mechanism of action in heated cells. In this case, HSF is activated and translocates to the cell nucleus, where it binds to the HSE, and the hsp70B′ promoter drives the therapeutic gene. Once the hsp70B′ promoter is activated, the tTA potentially activates transcription of the therapeutic gene, thus leading to transcriptional amplification of the TRE-HSP hybrid promoter mediated by tTA.

Figure 3. Reporter gene expression driven by the hybrid promoter. (A) HeLa cells were transfected with pTRE-HSP456/Z alone (open symbols) or pTRE-HSP456/Z plus pCMV/tTA (closed symbols), and incubated at 37°C (circles) or heated at 43°C for 1 h (triangles). As a control, HeLa cells were co-transfected with pTRE-CMVmin/Z and pCMV/tTA (cross symbols). The data are expressed as mean ± SD (n = 3). (B) HeLa cells were transfected with pTRE-HSP456/Z alone (open symbols) or pTRE-HSP456/Z plus pCMV/tTA (closed symbols), and incubated at 37°C (circles), 41°C (squares), 43°C (triangles) or 45°C (diamonds) for 1 h. Relative β-galactosidase activity is defined as the relative value of the β-galactosidase activity of the cells transfected with pTRE-HSP456/Z alone without heating (37°C) at 0 h. The data are expressed as mean ± SD (n = 3).
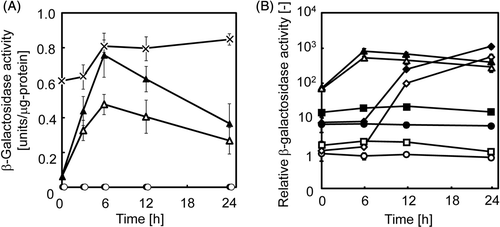
Figure 3. Reporter gene expression driven by the hybrid promoter. (A) HeLa cells were transfected with pTRE-HSP456/Z alone (open symbols) or pTRE-HSP456/Z plus pCMV/tTA (closed symbols), and incubated at 37°C (circles) or heated at 43°C for 1 h (triangles). As a control, HeLa cells were co-transfected with pTRE-CMVmin/Z and pCMV/tTA (cross symbols). The data are expressed as mean ± SD (n = 3). (B) HeLa cells were transfected with pTRE-HSP456/Z alone (open symbols) or pTRE-HSP456/Z plus pCMV/tTA (closed symbols), and incubated at 37°C (circles), 41°C (squares), 43°C (triangles) or 45°C (diamonds) for 1 h. Relative β-galactosidase activity is defined as the relative value of the β-galactosidase activity of the cells transfected with pTRE-HSP456/Z alone without heating (37°C) at 0 h. The data are expressed as mean ± SD (n = 3).

Figure 4. Deletion analysis of hsp70B′ promoter region in the hybrid promoter. The structures of the hsp70B′ promoter region of pTRE-HSP456/Z and the 5′-deletion mutants, pTRE-HSP391/Z and pTRE-HSP244/Z are shown in the left panel. Arrows indicate the position of putative HSEs. The β-galactosidase activities of each construct at 24 h after heat treatment at 43°C for 1 h are shown in the right panel. Open and closed columns indicate that cells were transfected with the reporter gene expression plasmid alone, and the reporter gene expression plasmid plus transactivator expression plasmid, respectively. Relative β-galactosidase activity is defined as the relative value to the β-galactosidase activity of the cells transfected with pTRE-HSP244/Z alone. The data are expressed as mean ± SD (n = 3).
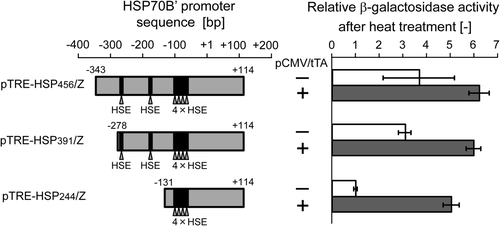
Figure 4. Deletion analysis of hsp70B′ promoter region in the hybrid promoter. The structures of the hsp70B′ promoter region of pTRE-HSP456/Z and the 5′-deletion mutants, pTRE-HSP391/Z and pTRE-HSP244/Z are shown in the left panel. Arrows indicate the position of putative HSEs. The β-galactosidase activities of each construct at 24 h after heat treatment at 43°C for 1 h are shown in the right panel. Open and closed columns indicate that cells were transfected with the reporter gene expression plasmid alone, and the reporter gene expression plasmid plus transactivator expression plasmid, respectively. Relative β-galactosidase activity is defined as the relative value to the β-galactosidase activity of the cells transfected with pTRE-HSP244/Z alone. The data are expressed as mean ± SD (n = 3).

Figure 5. In vitro cytotoxicity of heat-inducible TNF-α gene expression. HeLa (A and B), HepG2 (C and D) and A549 (E and F) cells were transfected with the mock plasmid (white columns), pTRE-HSP456/α alone (grey columns) or pTRE-HSP456/α plus pCMV/tTA (black columns). The cells were incubated at 37°C or underwent heat treatment at 43°C or 45°C for 1 h. At 24 h after heat treatment, cells and culture medium were collected for the cell viability assay (A, C and E) and ELISA for TNF-α (B, D and F), respectively. The data are expressed as mean ± SD (n = 3). *P < 0.05 and **P < 0.05 versus the mock plasmid and pTRE-HSP456/α alone at each temperature, respectively. ND, not detected, where the minimum detectable range of TNF-α using the ELISA kit is > 1.6 pg/mL, according to the manufacturer's instruction.
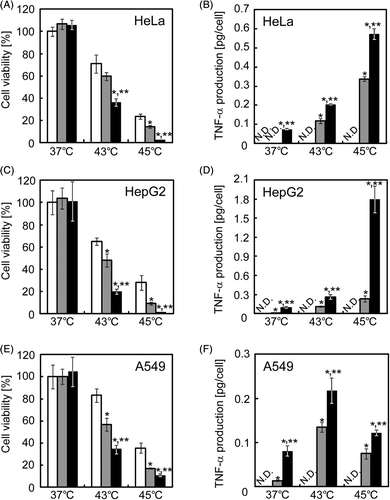
Figure 5. In vitro cytotoxicity of heat-inducible TNF-α gene expression. HeLa (A and B), HepG2 (C and D) and A549 (E and F) cells were transfected with the mock plasmid (white columns), pTRE-HSP456/α alone (grey columns) or pTRE-HSP456/α plus pCMV/tTA (black columns). The cells were incubated at 37°C or underwent heat treatment at 43°C or 45°C for 1 h. At 24 h after heat treatment, cells and culture medium were collected for the cell viability assay (A, C and E) and ELISA for TNF-α (B, D and F), respectively. The data are expressed as mean ± SD (n = 3). *P < 0.05 and **P < 0.05 versus the mock plasmid and pTRE-HSP456/α alone at each temperature, respectively. ND, not detected, where the minimum detectable range of TNF-α using the ELISA kit is > 1.6 pg/mL, according to the manufacturer's instruction.

Figure 6. In vitro cytotoxicity of heat-inducible HSV-tk gene therapy. HeLa (A), HepG2 (B) and A549 (C) cells were transfected with the mock plasmid (white columns), pTRE-HSP456/tk alone (grey columns) or pTRE-HSP456/tk plus pCMV/tTA (black columns). Cells were incubated at 37°C or underwent heat treatment at 43°C or 45°C for 1 h. At 24 h after heat treatment, cell viability was evaluated by the WST-8 method. The data are expressed as mean ± SD (n = 3). *P < 0.05 and **P < 0.05 versus the mock plasmid and pTRE-HSP456/tk alone at each temperature, respectively. (D–G) Microscopic observation of HeLa cells after gene delivery and heat treatment. Cells were transfected with the mock plasmid (D and E), pTRE-HSP456/tk alone (F) or pTRE-HSP456/tk plus pCMV/tTA (G), and incubated at 37°C (D) or heated at 43°C for 1 h (E–G). Apoptotic cells were detected by fluorescence microscopy based on the TUNEL assay. (Left) Bright field microscopic images. (Right) Fluorescence microscopic images.
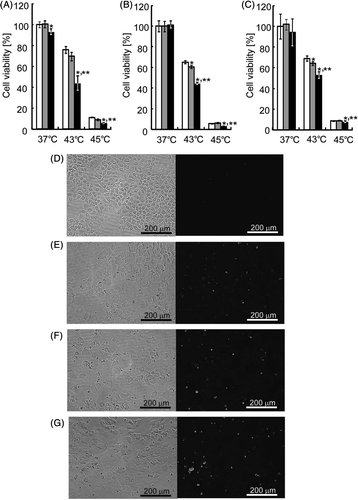
Figure 6. In vitro cytotoxicity of heat-inducible HSV-tk gene therapy. HeLa (A), HepG2 (B) and A549 (C) cells were transfected with the mock plasmid (white columns), pTRE-HSP456/tk alone (grey columns) or pTRE-HSP456/tk plus pCMV/tTA (black columns). Cells were incubated at 37°C or underwent heat treatment at 43°C or 45°C for 1 h. At 24 h after heat treatment, cell viability was evaluated by the WST-8 method. The data are expressed as mean ± SD (n = 3). *P < 0.05 and **P < 0.05 versus the mock plasmid and pTRE-HSP456/tk alone at each temperature, respectively. (D–G) Microscopic observation of HeLa cells after gene delivery and heat treatment. Cells were transfected with the mock plasmid (D and E), pTRE-HSP456/tk alone (F) or pTRE-HSP456/tk plus pCMV/tTA (G), and incubated at 37°C (D) or heated at 43°C for 1 h (E–G). Apoptotic cells were detected by fluorescence microscopy based on the TUNEL assay. (Left) Bright field microscopic images. (Right) Fluorescence microscopic images.

Reprints and Corporate Permissions

Please note: Selecting permissions does not provide access to the full text of the article, please see our help page How do I view content?

To request a reprint or corporate permissions for this article, please click on the relevant link below:

Academic Permissions

Please note: Selecting permissions does not provide access to the full text of the article, please see our help page How do I view content?

Obtain permissions instantly via Rightslink by clicking on the button below:

If you are unable to obtain permissions via Rightslink, please complete and submit this Permissions form. For more information, please visit our Permissions help page.