Figures & data
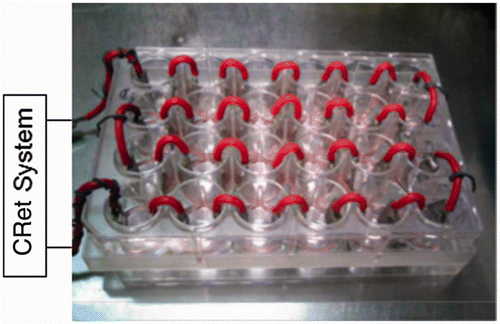
Figure 1. The pairs of stainless electrodes were inserted in each well and connected to the hyperthermia apparatus with a capacitive-resistive electric transfer (CRet) system.

Figure 2. Inhibitory effects of hyperthermia at 42°C using a CRet system on intracellular lipid accumulation in OP9 mouse stromal cells as assessed spectrophotometrically by Oil Red O stain and Hoffman modulation contrast microscopy. A: OP9 cells were induced to differentiation and exposed to hyperthermia at 42°C for 0 min, 0.5 min, 1 min, or 3 min using a CRet system. Then intracellular lipid droplets and nucleus were stained with Oil Red O and Mayer's hemalum solution, respectively. The absorbances of extracts from intracellular lipid droplets stained with Oil Red O were measured at 530 nm and evaluated as % of the positive control which was differentiated but did not undergo the hyperthermia. % of adipogenesis = [(Abs530 nm of test − Abs530 nm of undifferentiated control)/(Abs530 nm of differentiated adipocyte control − Abs530 nm of undifferentiated control)] × 100. Mean ± SD, n = 3, *p < 0.05 (vs. 0 min). B: Scale bars = 50 µm, magnification: ×200.
![Figure 2. Inhibitory effects of hyperthermia at 42°C using a CRet system on intracellular lipid accumulation in OP9 mouse stromal cells as assessed spectrophotometrically by Oil Red O stain and Hoffman modulation contrast microscopy. A: OP9 cells were induced to differentiation and exposed to hyperthermia at 42°C for 0 min, 0.5 min, 1 min, or 3 min using a CRet system. Then intracellular lipid droplets and nucleus were stained with Oil Red O and Mayer's hemalum solution, respectively. The absorbances of extracts from intracellular lipid droplets stained with Oil Red O were measured at 530 nm and evaluated as % of the positive control which was differentiated but did not undergo the hyperthermia. % of adipogenesis = [(Abs530 nm of test − Abs530 nm of undifferentiated control)/(Abs530 nm of differentiated adipocyte control − Abs530 nm of undifferentiated control)] × 100. Mean ± SD, n = 3, *p < 0.05 (vs. 0 min). B: Scale bars = 50 µm, magnification: ×200.](/cms/asset/10802769-cebd-4136-b2eb-efe62acf482e/ihyt_a_750016_f0002_b.gif)
Figure 3. Inhibitory effects of ascorbic acid-2-O-phosphate-Na2 (APS) in combined application of hyperthermia at 41°C for 1 min on intracellular lipid accumulation in OP9 cells as measured spectrophotometrically for Oil Red O stain. OP9 cells were induced to differentiation and exposed to treatment with APS and hyperthermia at 41°C for 1 min using a CRet system [CRet (+)] or sham-manipulated [CRet (−)] then treated as described in . Mean ± SD, n = 3, *p < 0.05 (vs. 0 mM of sham-manipulated), #p < 0.05 (vs. each dose of sham-manipulated).
![Figure 3. Inhibitory effects of ascorbic acid-2-O-phosphate-Na2 (APS) in combined application of hyperthermia at 41°C for 1 min on intracellular lipid accumulation in OP9 cells as measured spectrophotometrically for Oil Red O stain. OP9 cells were induced to differentiation and exposed to treatment with APS and hyperthermia at 41°C for 1 min using a CRet system [CRet (+)] or sham-manipulated [CRet (−)] then treated as described in Figure 3. Mean ± SD, n = 3, *p < 0.05 (vs. 0 mM of sham-manipulated), #p < 0.05 (vs. each dose of sham-manipulated).](/cms/asset/0d22d055-cdbe-4168-8183-942701cf2d37/ihyt_a_750016_f0003_b.gif)
Figure 4. Inhibitory effects of APS in combined application of hyperthermia at 41°C for 1 min on intracellular lipid accumulation in OP9 cells as observed using a Hoffman modulation contrast microscope. OP9 cells were treated as described in . Scale bars = 250 µm, magnification: ×40.

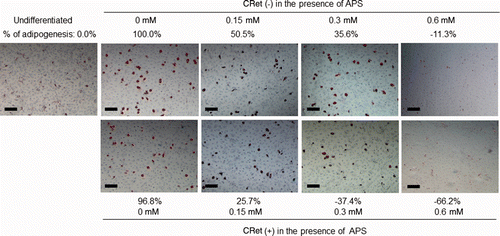
Figure 5. Inhibition of intracellular lipid accumulation by APS in combined application of hyperthermia at 41°C for 1 min using a CRet system [CRet (+)] in OP9 cells with comparing to differentiated control of sham-manipulated [CRet (−)] as observed using a Hoffman modulation contrast microscope. OP9 cells were treated as described in . Scale bars = 50 µm, magnification: ×200.
![Figure 5. Inhibition of intracellular lipid accumulation by APS in combined application of hyperthermia at 41°C for 1 min using a CRet system [CRet (+)] in OP9 cells with comparing to differentiated control of sham-manipulated [CRet (−)] as observed using a Hoffman modulation contrast microscope. OP9 cells were treated as described in Figure 3. Scale bars = 50 µm, magnification: ×200.](/cms/asset/139923e4-d3da-4102-8ee6-acd07ebbaa05/ihyt_a_750016_f0005_b.gif)
Figure 6. Inhibition of intracellular lipid accumulation by APS in combined application of hyperthermia at 41°C for 1 min using a CRet system [CRet (+)] in OP9 cells with comparing to differentiated control of sham-manipulated [CRet (−)] as observed using a Hoffman modulation contrast microscope. OP9 cells were treated as described in . Scale bars = 10 µm, magnification: ×200.
![Figure 6. Inhibition of intracellular lipid accumulation by APS in combined application of hyperthermia at 41°C for 1 min using a CRet system [CRet (+)] in OP9 cells with comparing to differentiated control of sham-manipulated [CRet (−)] as observed using a Hoffman modulation contrast microscope. OP9 cells were treated as described in Figure 3. Scale bars = 10 µm, magnification: ×200.](/cms/asset/59618443-30a9-4493-a7f0-450f9328baa7/ihyt_a_750016_f0006_b.gif)
Figure 7. Surface ultrastructure of OP9 cells treated with 0.6 mM APS combined with hyperthermia at 41°C for 1 min using a CRet system [CRet (+)] or sham-manipulated [CRet (−)], which was observed using a scanning electron microscope. OP9 cells were treated as described in . Scale bars = 10 µm, magnification: ×1500.
![Figure 7. Surface ultrastructure of OP9 cells treated with 0.6 mM APS combined with hyperthermia at 41°C for 1 min using a CRet system [CRet (+)] or sham-manipulated [CRet (−)], which was observed using a scanning electron microscope. OP9 cells were treated as described in Figure 3. Scale bars = 10 µm, magnification: ×1500.](/cms/asset/37eae344-9608-4782-8f2b-c7b5339a2db8/ihyt_a_750016_f0007_b.gif)