601
Views
12
CrossRef citations to date
0
Altmetric
Research Article

Mild hyperthermia enhances the expression and induces oscillations in the Dicer protein

, &
Pages 51-61 | Received 09 Aug 2012, Accepted 22 Nov 2012, Published online: 11 Jan 2013

Figures & data

Figure 1. Transcriptional response of Hsp70 and Hsp90 to fever-range hyperthermia. Mild hyperthermia at 39.5°C induced Hsp70 and Hsp90 mRNA. Bar graphs depict fold changes in mRNA that were measured by RT-qPCR and normalised to GAPDH. Control sample represents cells maintained at 37°C. Human cell lines JAR (placental choriocarcinoma) and HeLa (cervical carcinoma) display typical in vitro response patterns of cells grown at 39.5°C for 8–9 h. Control Hsp70 mRNA expression is up-regulated quickly, peaking at 3–4 h (a, b). Expression levels then fall, stabilising after 7 h at a level above baseline expression. Expression of the Hsp90 gene rises more slowly than Hsp70, reaching a plateau after 5–7 h (c & d). Error bars were calculated using standard deviations based on technical replicates from one of three independent experiments. Statistically significant change in HSP mRNA was seen in both cell lines based on a two tailed Students t-test (p < 0.05).
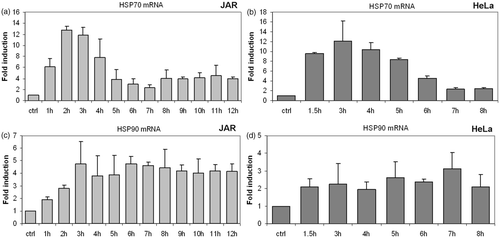
Figure 1. Transcriptional response of Hsp70 and Hsp90 to fever-range hyperthermia. Mild hyperthermia at 39.5°C induced Hsp70 and Hsp90 mRNA. Bar graphs depict fold changes in mRNA that were measured by RT-qPCR and normalised to GAPDH. Control sample represents cells maintained at 37°C. Human cell lines JAR (placental choriocarcinoma) and HeLa (cervical carcinoma) display typical in vitro response patterns of cells grown at 39.5°C for 8–9 h. Control Hsp70 mRNA expression is up-regulated quickly, peaking at 3–4 h (a, b). Expression levels then fall, stabilising after 7 h at a level above baseline expression. Expression of the Hsp90 gene rises more slowly than Hsp70, reaching a plateau after 5–7 h (c & d). Error bars were calculated using standard deviations based on technical replicates from one of three independent experiments. Statistically significant change in HSP mRNA was seen in both cell lines based on a two tailed Students t-test (p < 0.05).

Figure 2. Translational response of Hsp70 to fever range hyperthermia. Western blot analysis was used to determine Hsp70 protein expression following treatment at fever-range hyperthermia. (a) The human JAR trophoblast cell line showed elevations in Hsp70 protein in response to elevated temperatures by 4 h. A similar trend was observed in (b) HeLa cells. However, Hsp70 protein levels were reduced beyond the 6-h time point.
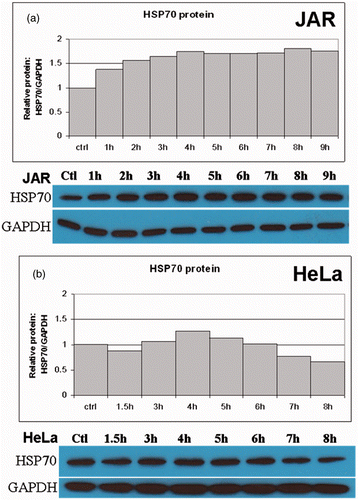
Figure 2. Translational response of Hsp70 to fever range hyperthermia. Western blot analysis was used to determine Hsp70 protein expression following treatment at fever-range hyperthermia. (a) The human JAR trophoblast cell line showed elevations in Hsp70 protein in response to elevated temperatures by 4 h. A similar trend was observed in (b) HeLa cells. However, Hsp70 protein levels were reduced beyond the 6-h time point.

Figure 3. Translational response of Hsp90 to fever range hyperthermia. Western blot analysis was used to analyse Hsp90 protein expression following treatment and fever-range hyperthermia. Hsp90 protein expression varied by cell line, but was enhanced at some point before 9 h of heat treatment. (a) The JAR cell line showed steadily increasing levels of Hsp90 through 7 h. (b) HeLa cells exhibited an interrupted pattern of HSP90 expression, with all time points elevated above baseline.
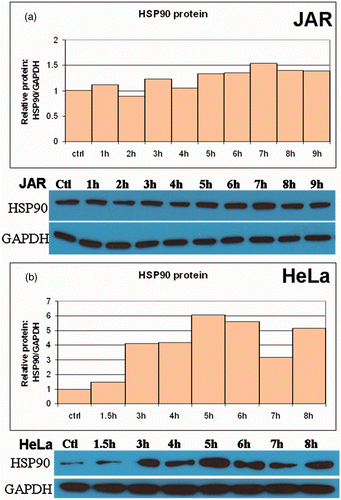
Figure 3. Translational response of Hsp90 to fever range hyperthermia. Western blot analysis was used to analyse Hsp90 protein expression following treatment and fever-range hyperthermia. Hsp90 protein expression varied by cell line, but was enhanced at some point before 9 h of heat treatment. (a) The JAR cell line showed steadily increasing levels of Hsp90 through 7 h. (b) HeLa cells exhibited an interrupted pattern of HSP90 expression, with all time points elevated above baseline.

Figure 4. Translational response of Dicer following treatment at fever range hyperthermia. In all cell lines where the response to thermal stress was confirmed by Hsp70 and Hsp90 mRNA and protein expression changes, levels of Dicer protein were found to fluctuate over the course of exposure to mild hyperthermia at 39.5°C (a). (b–d) Bar graphs in show quantified values obtained from the western blots shown in A. All cells except the breast cancer line BT-20 (b) clearly show fluctuations above the untreated control. Specific patterns of thermal response vary between cell types. Cells where Dicer protein was found to be heat responsive included human cancers (b) Raji, JAR, HeLa and SW13, murine cancer and non-cancer cell lines (c) B16, SM-9 and human lung fibroblast (MRC-5) and (d) primary cells (wild type mouse renal epithelial and fibroblast cells). Western blots and bar graphs are representative of two or more independent experiments.
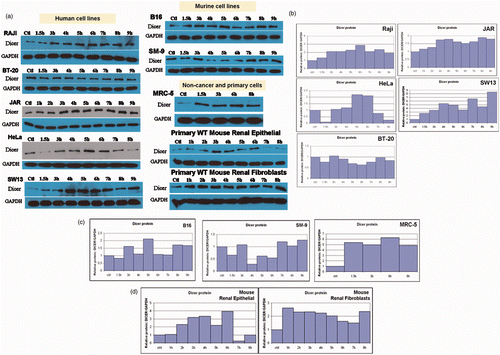
Figure 4. Translational response of Dicer following treatment at fever range hyperthermia. In all cell lines where the response to thermal stress was confirmed by Hsp70 and Hsp90 mRNA and protein expression changes, levels of Dicer protein were found to fluctuate over the course of exposure to mild hyperthermia at 39.5°C (a). (b–d) Bar graphs in show quantified values obtained from the western blots shown in A. All cells except the breast cancer line BT-20 (b) clearly show fluctuations above the untreated control. Specific patterns of thermal response vary between cell types. Cells where Dicer protein was found to be heat responsive included human cancers (b) Raji, JAR, HeLa and SW13, murine cancer and non-cancer cell lines (c) B16, SM-9 and human lung fibroblast (MRC-5) and (d) primary cells (wild type mouse renal epithelial and fibroblast cells). Western blots and bar graphs are representative of two or more independent experiments.

Figure 5. Dicer protein levels fluctuate in response to fever-range hyperthermia, with little change in Dicer mRNA. Bar graphs show Dicer mRNA expression expressed as fold induction relative to GAPDH. Specific patterns of protein fluctuations vary with cell lines, but changes in Dicer protein expression were present in all cells following treatment with fever range hyperthermia. Dicer mRNA levels do not show significant variation (p > 0.05) in the JAR (a) and HeLa (b) cell lines, suggesting that Dicer is regulated post-transcriptionally in these cells. Error bars were calculated using standard deviations based on technical replicates from three independent experiments. Statistical significance was assigned based on a two-tailed Students t-test and found to be significant.

Figure 5. Dicer protein levels fluctuate in response to fever-range hyperthermia, with little change in Dicer mRNA. Bar graphs show Dicer mRNA expression expressed as fold induction relative to GAPDH. Specific patterns of protein fluctuations vary with cell lines, but changes in Dicer protein expression were present in all cells following treatment with fever range hyperthermia. Dicer mRNA levels do not show significant variation (p > 0.05) in the JAR (a) and HeLa (b) cell lines, suggesting that Dicer is regulated post-transcriptionally in these cells. Error bars were calculated using standard deviations based on technical replicates from three independent experiments. Statistical significance was assigned based on a two-tailed Students t-test and found to be significant.

Figure 6. Effects of fever range hyperthermia on selected microRNA. Expression levels of eight microRNAs previously identified to be thermally regulated (see text) were analysed by RT-qPCR. (a) miR-125 b and miR-154 were found to be thermally up-regulated in HeLa cells. (b) In JAR, miR-382 was found to be enhanced by thermal stress.
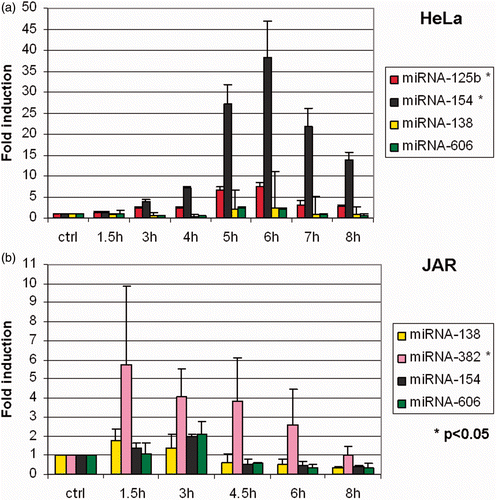
Figure 6. Effects of fever range hyperthermia on selected microRNA. Expression levels of eight microRNAs previously identified to be thermally regulated (see text) were analysed by RT-qPCR. (a) miR-125 b and miR-154 were found to be thermally up-regulated in HeLa cells. (b) In JAR, miR-382 was found to be enhanced by thermal stress.

Reprints and Corporate Permissions

Please note: Selecting permissions does not provide access to the full text of the article, please see our help page How do I view content?

To request a reprint or corporate permissions for this article, please click on the relevant link below:

Academic Permissions

Please note: Selecting permissions does not provide access to the full text of the article, please see our help page How do I view content?

Obtain permissions instantly via Rightslink by clicking on the button below:

If you are unable to obtain permissions via Rightslink, please complete and submit this Permissions form. For more information, please visit our Permissions help page.