1,034
Views
28
CrossRef citations to date
0
Altmetric
Research Article

Investigation of the heating properties of platinum nanoparticles under a radiofrequency current

, &
Pages 99-105 | Received 10 Aug 2012, Accepted 14 Dec 2012, Published online: 28 Jan 2013

Figures & data

Figure 1. The schematic of the CET system. An RF current was applied from the active electrode (red) to the return electrode (black) through the incubation chamber. Each electrode was coated with an insulated material. An oscilloscope and a temperature sensor measured the electric parameters applied to the active electrode and the temperatures in the incubation chamber, respectively. Various concentrations of NPs (spherical black dots) in deionised water or buffer can be placed in the incubation chamber.
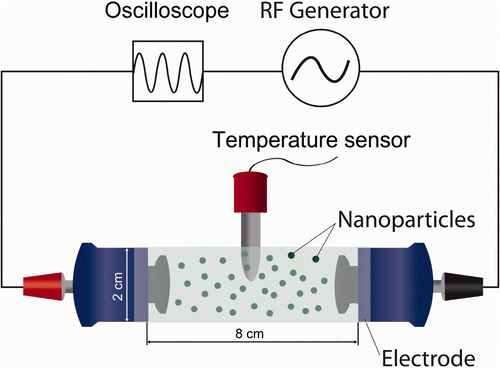
Figure 1. The schematic of the CET system. An RF current was applied from the active electrode (red) to the return electrode (black) through the incubation chamber. Each electrode was coated with an insulated material. An oscilloscope and a temperature sensor measured the electric parameters applied to the active electrode and the temperatures in the incubation chamber, respectively. Various concentrations of NPs (spherical black dots) in deionised water or buffer can be placed in the incubation chamber.

Figure 2. TEM images of PtNPs (A) and AuNPs (B). The size distribution diagrams are shown in the bottom panels. The scale bar in the TEM picture is 50 nm.

Figure 2. TEM images of PtNPs (A) and AuNPs (B). The size distribution diagrams are shown in the bottom panels. The scale bar in the TEM picture is 50 nm.

Figure 3. Heating rate of the PtNPs (A) and AuNPs (B) at various concentrations. The temperatures of the PtNPs and AuNPs in the deionised water were monitored every 5 s for 5 min. The largest temperature increment was observed in the PtNP solution.

Figure 3. Heating rate of the PtNPs (A) and AuNPs (B) at various concentrations. The temperatures of the PtNPs and AuNPs in the deionised water were monitored every 5 s for 5 min. The largest temperature increment was observed in the PtNP solution.

Figure 4. Concentration dependence of the RF heating rates of the PtNPs (black circles) and AuNPs (white circles). The heating rates of NPs at each concentration were the temperature changes over 5 min from . The solid lines were obtained using least squares regression analysis. The heating rate of the PtNPs was about two-fold higher than that of the AuNPs.
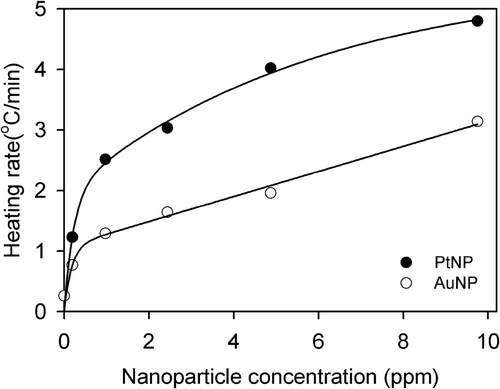
Figure 4. Concentration dependence of the RF heating rates of the PtNPs (black circles) and AuNPs (white circles). The heating rates of NPs at each concentration were the temperature changes over 5 min from Figure 3. The solid lines were obtained using least squares regression analysis. The heating rate of the PtNPs was about two-fold higher than that of the AuNPs.

Figure 5. Heating rates of the PtNPs (A) and AuNPs (B) at the power ranges of 20 to 50 W. Under the exposure of the NP solution to the RF current at a given power, the temperatures of the PtNPs and AuNPs at the concentration of 2.5 ppm in the deionised water were monitored every 5 s for 5 min.

Figure 5. Heating rates of the PtNPs (A) and AuNPs (B) at the power ranges of 20 to 50 W. Under the exposure of the NP solution to the RF current at a given power, the temperatures of the PtNPs and AuNPs at the concentration of 2.5 ppm in the deionised water were monitored every 5 s for 5 min.

Figure 6. Heating rates of PtNPs (black circles) and AuNPs (white circles) in DPBS solution. PtNPs and AuNPs prepared in 1 × DPBS solution at a concentration of 2.5 ppm were exposed to a 40 W RF current and their temperatures were monitored for 5 min. The temperature changes of the DPBS solution were also measured under the same conditions as a control (black triangles). The temperature changes induced by PtNP and AuNP, calculated by subtracting the temperatures of the control from those of the NP solutions, are also displayed in the inset.
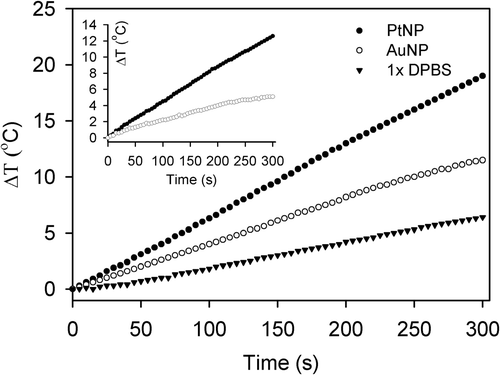
Figure 6. Heating rates of PtNPs (black circles) and AuNPs (white circles) in DPBS solution. PtNPs and AuNPs prepared in 1 × DPBS solution at a concentration of 2.5 ppm were exposed to a 40 W RF current and their temperatures were monitored for 5 min. The temperature changes of the DPBS solution were also measured under the same conditions as a control (black triangles). The temperature changes induced by PtNP and AuNP, calculated by subtracting the temperatures of the control from those of the NP solutions, are also displayed in the inset.

Reprints and Corporate Permissions

Please note: Selecting permissions does not provide access to the full text of the article, please see our help page How do I view content?

To request a reprint or corporate permissions for this article, please click on the relevant link below:

Academic Permissions

Please note: Selecting permissions does not provide access to the full text of the article, please see our help page How do I view content?

Obtain permissions instantly via Rightslink by clicking on the button below:

If you are unable to obtain permissions via Rightslink, please complete and submit this Permissions form. For more information, please visit our Permissions help page.