Figures & data
Figure 1. Block diagram of the experimental setup for temperature measurements and cavitation detection. The cell and liposome-embedding tissue-mimicking material was immersed in a water tank maintained at 37°C. A thermocouple was inserted in the material and aligned to the HIFU focus, to enable monitoring of the focal temperature throughout the exposure. Acoustic emissions were monitored with a Passive Cavitation Detector (PCD) confocally aligned with the High Intensity Focused Ultrasound (HIFU) transducer. The continuous, dashed and dotted lines indicate the sonication, cavitation-detection and temperature measurement loops respectively.
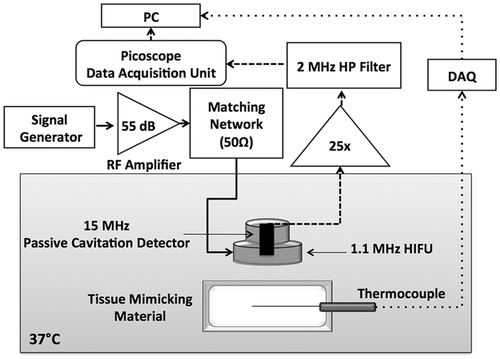
Figure 2. Experimental data for degassed bovine liver at 37°C and literature values for liver tissue in mammals. The experimental results are shown as mean values and error bars of size double the standard deviation. The dotted and dashed lines represent the upper and lower limits for mammalian liver attenuation as reported in the literature. The continuous line shows a representative linear approximation for ox liver attenuation from Duck et al. [36].
![Figure 2. Experimental data for degassed bovine liver at 37°C and literature values for liver tissue in mammals. The experimental results are shown as mean values and error bars of size double the standard deviation. The dotted and dashed lines represent the upper and lower limits for mammalian liver attenuation as reported in the literature. The continuous line shows a representative linear approximation for ox liver attenuation from Duck et al. [36].](/cms/asset/4e50579c-ddd4-4ca0-b0a9-52d0477b1476/ihyt_a_762553_f0002_b.gif)
Figure 3. Measured values of attenuation coefficient versus frequency with the through-transmission method in a 0.5% and 1% agarose tissue-mimicking material (TMM) with 2% glass microspheres (A) and in a 1% agarose TMM with 0.44%, 1%, 2% and 4% glass microspheres (B). The 4% microsphere TMM presents significantly higher attenuation over the whole frequency range.
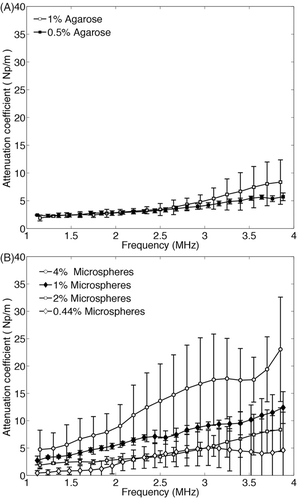
Figure 4. Comparison of the experimental values of the attenuation coefficient of degassed liver (n = 3), the TMM (n = 4) and plain agarose gel. The TMM exhibits a much higher attenuation than the plain agarose gel, with similar attenuation profile to the degassed liver over the frequency range of 1–4 MHz.
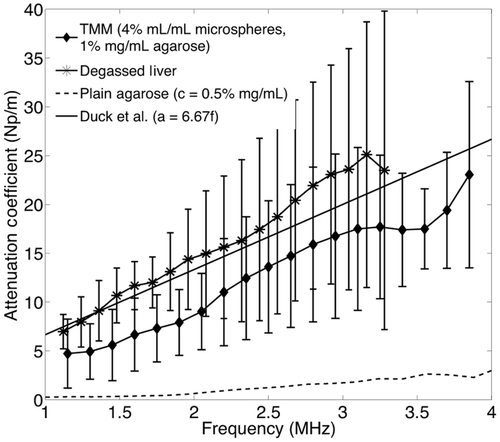
Figure 5. Representative FFTs of the signal received after exposure of degassed liver (left) and the novel TMM (right) to 6s continuous wave HIFU sonications at 1.1 MHz. (A), (C) and (E) correspond to 2.2, 4.4 and 8.8 MPa peak to peak HIFU exposures on liver tissue respectively. At 2.2 MPa no harmonic or broadband emissions are observed, whereas at 4.4 and 8.8 MPa there are harmonic emissions indicating non-linearity of the medium. No inertial cavitation activity is observed at any frequency. (B), (D) and (F) correspond to the same acoustic pressures applied to the TMM. Non-linearity of the medium can be seen by the high levels of harmonic emissions even at the low pressure of 2.2 MPa peak to peak. At 4.4 MPa, there are both harmonic and broadband emissions, with harmonic emissions dominating, whereas broadband emissions dominate at 8.8 MPa.
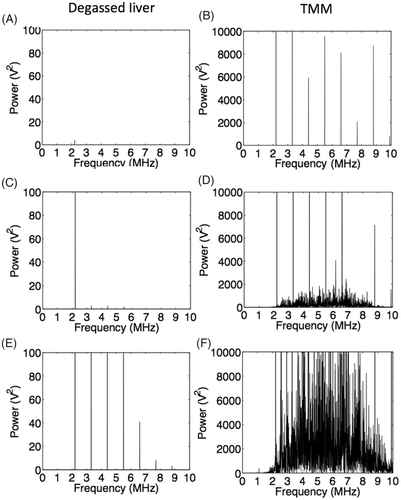
Figure 6. Effect of inertial cavitation activity on temperature rise at the HIFU focus in the TMM and the degassed tissue, during 6s exposures at 1.1 MHz. At 1.8 · 106 W · m−2 (corresponding to 4.8 MPa ppk), the maximum temperature rise caused to the TMM was almost 10°C higher than the one predicted by the linear model.
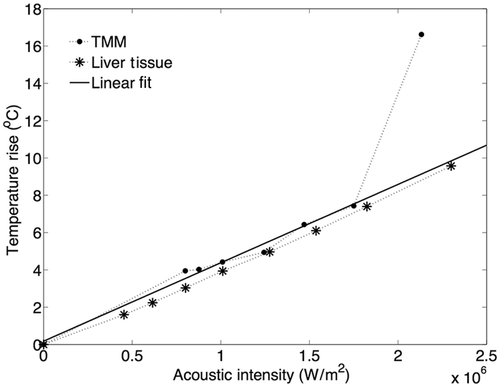
Figure 7. Temperature measurements at the HIFU focus during 6 s exposures at 1.1 MHz at three pressures below the cavitation threshold: 2.5, 3.4 and 4.4 MPa ppk, (A) in the liver and (B) the tissue-mimicking material (TMM) and three pressures above the cavitation threshold: 4.8, 5.6 and 6.6 MPa ppk in (C) the liver and (D) the TMM. Exposures at 4.4 MPa ppk produce hyperthermia in the range over which low-temperature sensitive liposomes release their content. At pressures above 4.8 MPa ppk, the presence of inertial cavitation activity causes significant increase in the temperature rise in the TMM (D), resulting in discrepancy from the temperature rises observed in liver (C) in the absence of inertial cavitation. For experiments in the liver tissue n = 3 and for experiments in the TMM n = 4.
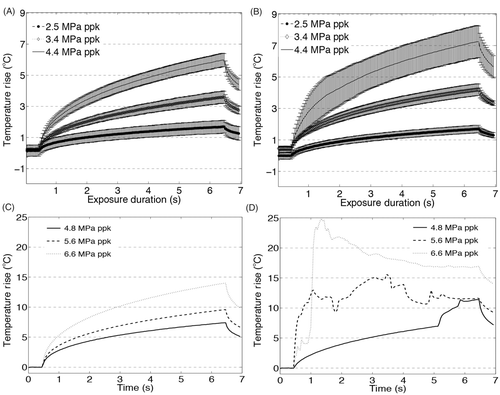
Figure 8. Acquired temperature profiles in the transverse plane of the focus of the 1.1 MHz HIFU transducer, during a 6 s CW exposure at 4.4 MPa ppk (A) in degassed liver tissue and (B) in the TMM. In both cases a region of radius approximately 1 mm is in the mild hyperthermia region.
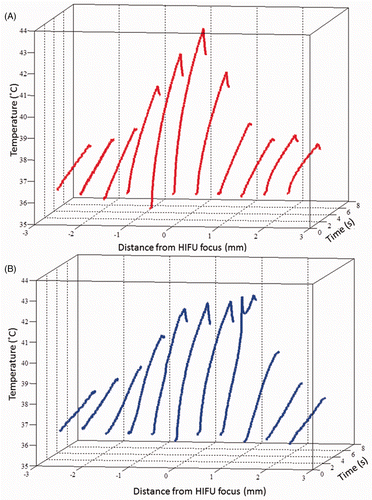
Figure 9. Cell viability in 1% agarose TMM with 0%, 2% and 4% (mL/mL) glass microspheres measured as a percentage of the luminescence intensity of cells in the various TMM compositions with respect to the luminescence intensity of cells in PBS (n = 4). In all cases, the background luminescence (luminescence of TMM without cells) was subtracted.
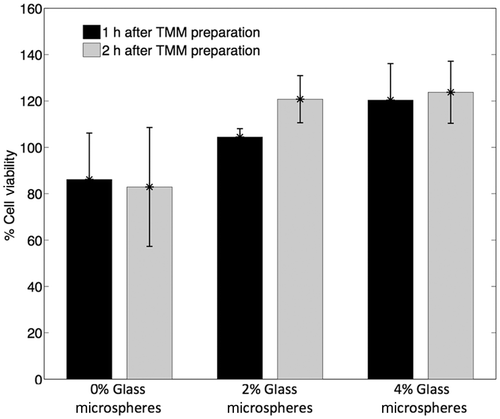
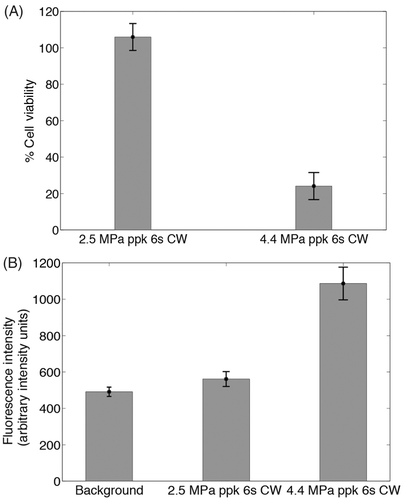
Figure 10. (A) Assessment of cell viability after exposing the liposome-embedding phantom to ultrasound conditions that cause and do not cause mild hyperthermia (4.4 MPa ppk, 6 s CW and 2.5 MPa ppk, 6 s CW respectively). Cell viability is measured by luminescence intensity, as a percentage of the luminescence intensity of areas of the phantom not exposed to HIFU (n = 4). (B) Assessment of doxorubicin release from the liposomes under the same conditions, measured by the fluorescence intensity of released doxorubicin (n = 4). No cell death is induced unless sufficient levels of hyperthermia are reached to release the drug.
