516
Views
10
CrossRef citations to date
0
Altmetric
Research Article

Highly focalised thermotherapy using a ferrimagnetic cement in the treatment of a melanoma mouse model by low temperature hyperthermia

, , , , , , , & show all
Pages 121-132 | Received 07 Aug 2012, Accepted 11 Jan 2013, Published online: 18 Feb 2013

Figures & data

Figure 1. Radiographic (A) and photographic (B) image of mouse tumour after FC injection. The FC radiopacity allows its localisation.
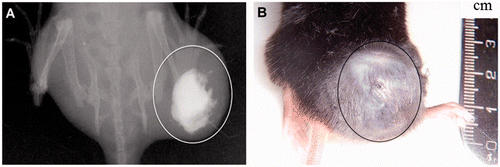
Figure 1. Radiographic (A) and photographic (B) image of mouse tumour after FC injection. The FC radiopacity allows its localisation.

Figure 2. Animal thermographic image. (A) Initial state temperature. The spot (SPO1) was localised in the body and the area (ARO1) corresponds to the tumour. (B) The exposure at the HFMF caused a temperature increase and it was maintained during the treatment (30 min).
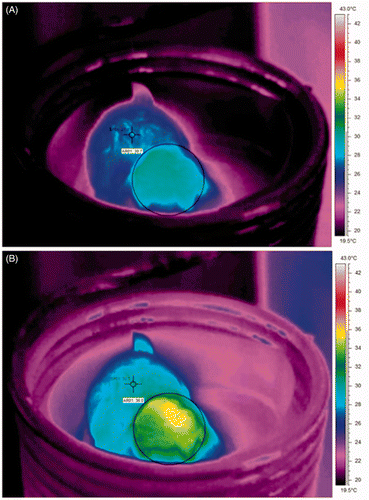
Figure 2. Animal thermographic image. (A) Initial state temperature. The spot (SPO1) was localised in the body and the area (ARO1) corresponds to the tumour. (B) The exposure at the HFMF caused a temperature increase and it was maintained during the treatment (30 min).

Figure 3. The time courses of tumour growth over 12 days in the animals of control groups I and II and treatment group: average tumour volume (mm3) at 2-day intervals. The FC injection within the tumour was performed at day 0 (group II and the treatment group). Animals of the treatment group were exposed to HFMF at days 2, 4 and 6. *Significantly different from control group I; #Significantly different from control group II.
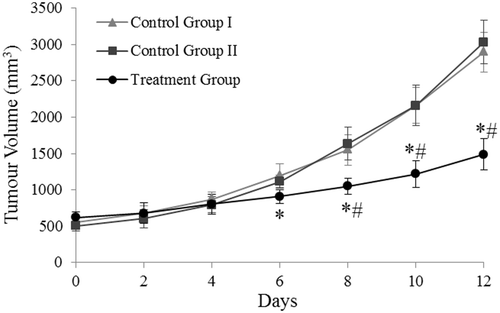
Figure 3. The time courses of tumour growth over 12 days in the animals of control groups I and II and treatment group: average tumour volume (mm3) at 2-day intervals. The FC injection within the tumour was performed at day 0 (group II and the treatment group). Animals of the treatment group were exposed to HFMF at days 2, 4 and 6. *Significantly different from control group I; #Significantly different from control group II.

Figure 4. (A) Morphological SEM appearance of a FC sample, injected within the tumour. (B) EDS analysis of the FC surface (Z8), which is mainly composed of calcium associated with phosphorus and carbon; EDS analysis within FC (Z9), showing Ca, Fe, Si, Al, and Mg associated to P and C peaks.
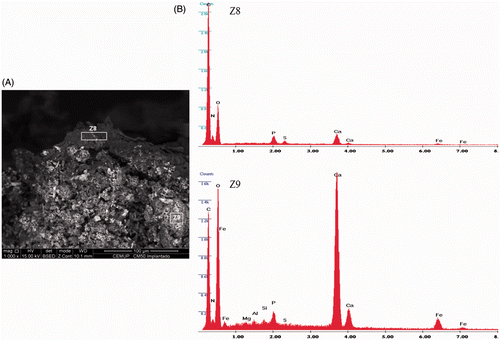
Figure 4. (A) Morphological SEM appearance of a FC sample, injected within the tumour. (B) EDS analysis of the FC surface (Z8), which is mainly composed of calcium associated with phosphorus and carbon; EDS analysis within FC (Z9), showing Ca, Fe, Si, Al, and Mg associated to P and C peaks.

Figure 5. Perls’ staining of lung (A), liver (B), spleen (C) and tumour (D) of the treatment group animals. The iron was detected in the spleen and in the tumour, near to FC. Bar = 25 µm.
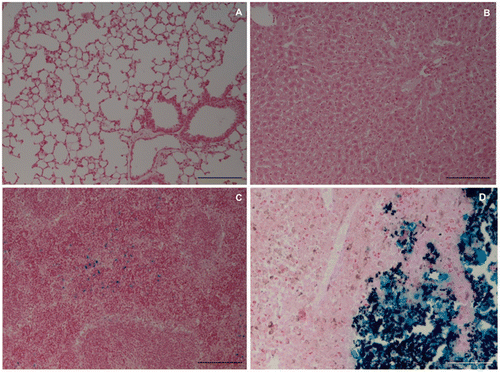
Figure 5. Perls’ staining of lung (A), liver (B), spleen (C) and tumour (D) of the treatment group animals. The iron was detected in the spleen and in the tumour, near to FC. Bar = 25 µm.

Figure 6. Histological analysis (HE) of the tumour from the treatment group (left image) and control group II (right image). Treatment group: the upper right corner shows the neoplastic cells (A) with areas of necrosis (B), inflammatory infiltrate (C) composed mainly of lymphocytes and plasma cells (arrows); in the lower left corner, the ferrimagnetic material (D). Control group II: the image's right site shows the tumour cells (A), some inflammatory infiltrate (B) and small necrotic areas (C) associated with FC (D). Bar = 12.5 µm.
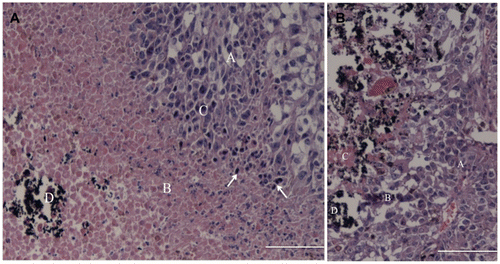
Figure 6. Histological analysis (HE) of the tumour from the treatment group (left image) and control group II (right image). Treatment group: the upper right corner shows the neoplastic cells (A) with areas of necrosis (B), inflammatory infiltrate (C) composed mainly of lymphocytes and plasma cells (arrows); in the lower left corner, the ferrimagnetic material (D). Control group II: the image's right site shows the tumour cells (A), some inflammatory infiltrate (B) and small necrotic areas (C) associated with FC (D). Bar = 12.5 µm.

Figure 7. Immunohistochemistry for caspase-3 in the tumour from the treatment group (A–C) and the control group II (D). In the treatment group, moderate cytoplasmic immunostaining in most of the tumour cells, and strong immunostaining in a few scattered cells, at 4 h (A), 24 h (B) and 48 h (C) after the treatment; the decrease in the number of apoptotic cells is evident. Comparatively, samples from control group II showed a lower staining (D). Bar = 12.5 µm. The immunohistochemistry index is also shown (E).
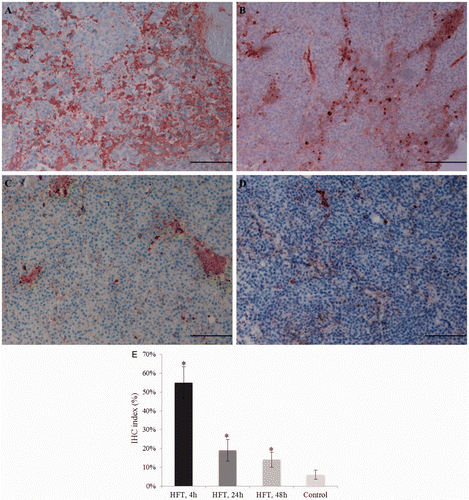
Figure 7. Immunohistochemistry for caspase-3 in the tumour from the treatment group (A–C) and the control group II (D). In the treatment group, moderate cytoplasmic immunostaining in most of the tumour cells, and strong immunostaining in a few scattered cells, at 4 h (A), 24 h (B) and 48 h (C) after the treatment; the decrease in the number of apoptotic cells is evident. Comparatively, samples from control group II showed a lower staining (D). Bar = 12.5 µm. The immunohistochemistry index is also shown (E).

Reprints and Corporate Permissions

Please note: Selecting permissions does not provide access to the full text of the article, please see our help page How do I view content?

To request a reprint or corporate permissions for this article, please click on the relevant link below:

Academic Permissions

Please note: Selecting permissions does not provide access to the full text of the article, please see our help page How do I view content?

Obtain permissions instantly via Rightslink by clicking on the button below:

If you are unable to obtain permissions via Rightslink, please complete and submit this Permissions form. For more information, please visit our Permissions help page.