Figures & data
Figure 1. Experimental procedures. NC, normothermic controls; HI, hyperthermic injury; HSPre, heat shock preconditioning; HSPre + triptolide, heat shock preconditioning plus triptolide.
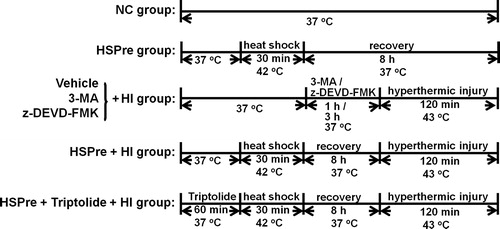
Figure 2. Cell viability of different degrees of temperature and different treatment time in the hyperthermic injury (HI). Cells were immersed in a circulating water bath at indicated periods of temperature (A) and time (B). After hyperthermic injury, cells were immediately incubated in MTT reagent for 4 h at 37 °C, and then analysed by optic density (OD) 450 nm. Data were presented as the means ± SD of three independent experiments and were compared among groups with ANOVA (F test) following by Bonferroni adjusted t-tests (p < 0.05).
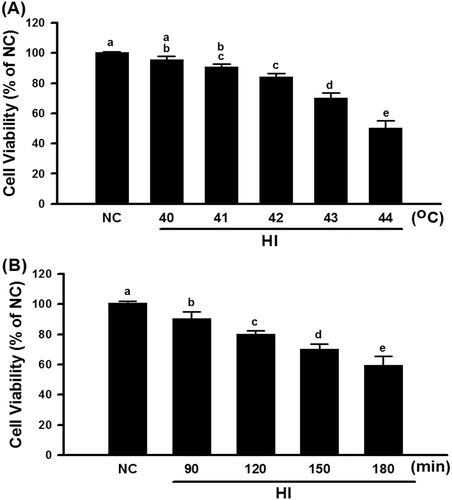
Figure 3. HSPre induced the expression of HSP70 and had a spike at recovery 8 h. Cells suffered from a sub-lethal heat shock at 42 °C for 30 min in a circulating water bath followed by recovery of the indicated period time to express the HSP70 at 37 °C. Data were presented as the means ± SD of three independent experiments and were compared among groups with ANOVA (F test) followed by Bonferroni’s adjusted t-test (p < 0.05).
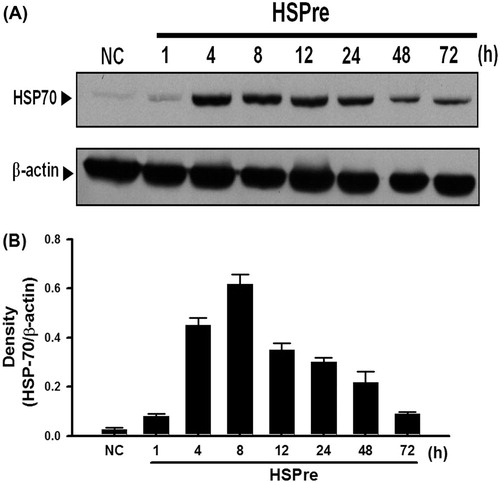
Figure 4. The inhibitor triptolide blocked the effect of HSPre-induced HSP70 expression. Immunoblotting analysed the HSP70 after HSPre with/without triptolide pretreatment. Data were presented as the means ± SD of three independent experiments. †p < 0.05 in comparison with NC group. ‡p < 0.05 in comparison with the HSPre group. Please see the legends of for group abbreviations.
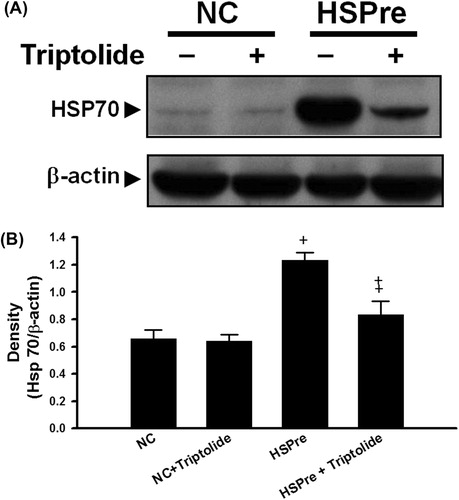
Figure 5. The protective effect of HSPre, 3-MA preconditioning or z-DEVD-FMK preconditioning significantly attenuated HI-induced cell death. Cells were processed by hyperthermic injury in a 43 °C circulating water bath for 120 min; however, its damage was significantly attenuated by HSPre. Data were presented as the means ± SD of three independent experiments. †p < 0.05 in comparison with NC. ‡p < 0.05 in comparison with HI. #p < 0.05 in comparison with the HSPre + HI group. Please see the legends of for group abbreviations.
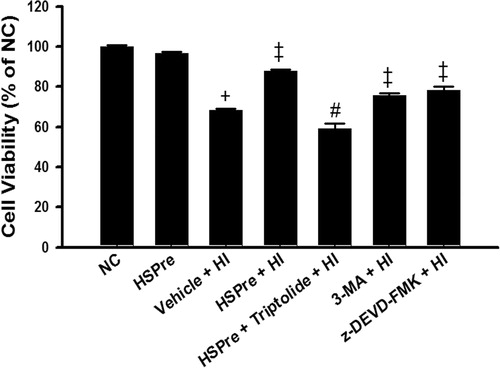
Figure 6. The LDH release that increased in HI was attenuated by HSPre. Data were presented as the means ± SD of three independent experiments. †p < 0.05 in comparison with NC. ‡p < 0.05 in comparison with HI. #p < 0.05 in comparison with HSPre + HI. Please see the legends of for group abbreviations.
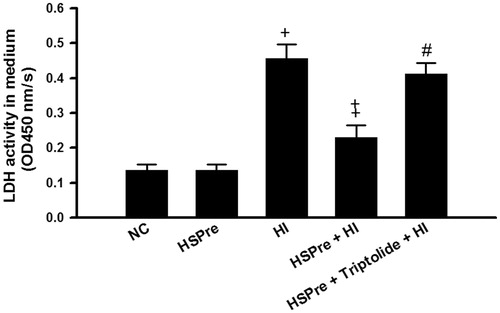
Figure 7. The level of apoptosis that increased in HI was attenuated by HSPre. Apoptosis was analysed according to the commercially available protocol (Annexin V-FITC kit; Beckman Coulter). Cells were analysed by flow cytometry using a Beckman Flow Cytometer, with results (1) viable cells that did not stain with either reagent (B3 area), (2) necrotic cells that stained with both reagent (B2 area), and (3) apoptotic cells that stained with annexin V-FITC only (B4 area). Data were presented as the means ± SD of three independent experiments. †p < 0.05 in comparison with NC. ‡p < 0.05 in comparison with HI group. #p < 0.05 in comparison with HSPre + HI group. Please see the legends of for group abbreviations.
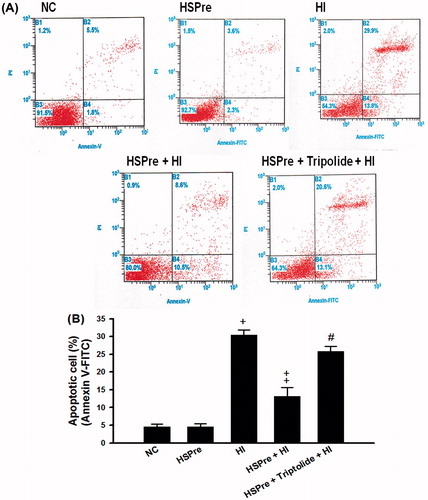
Figure 8. The level of caspase-3 activity that increased in HI was attenuated by HSPre. Caspase-3 activity was analysed according to the commercially available protocol (Sigma). Equal concentration of extract protein was reacted with caspase-3 substrate (Ac-DEVD-p-NA), and then the cleaved p-NA was detected at OD 405 nm and was calculated from the p-NA standard curve to gain intensity of caspase-3 activity. †p < 0.05 in comparison with NC. ‡p < 0.05 in comparison with HI. #p < 0.05 in comparison with HSPre + HI. Data were presented as the means ± SD of three independent experiments. Please see the legends of for group abbreviations.
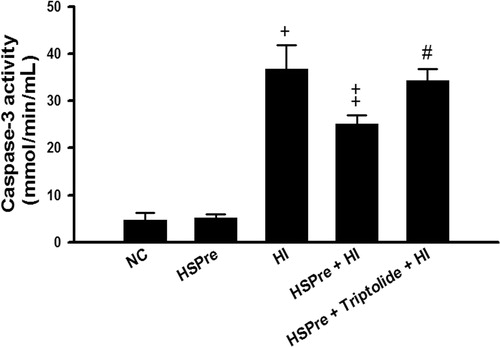
Figure 9. Autophagosome marker LC3-II that increased in HI was attenuated by HSPre. In cytosolic soluble form of LC3-I converted into the autophagic vesicle-associated form of LC-3 II that was used as a marker of autophagosome formation. Immunoblotting was used to analyse the LC-II expression and LC-I conversion into LC-II ratio (LC-II/total LC-3 (LC3-I + LC3-II)). Data were independently performed three times and presented at quality (A), quantity (B) and LC3-II/total LC3 ratio (C). †p < 0.05 in comparison with NC. ‡p < 0.05 in comparison with HI. #p < 0.05 in comparison with HSPre + HI group. Please see the legends of for group abbreviation.
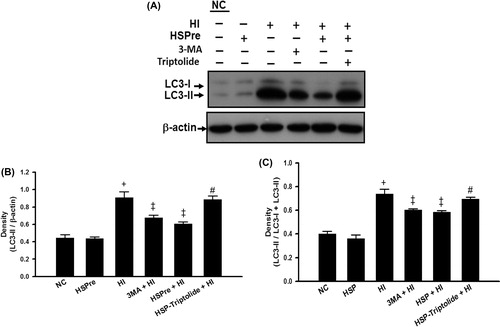
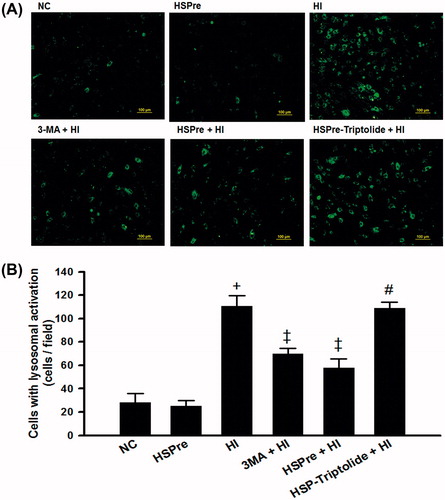
Figure 10. The lysosomal activity that increased in HI was attenuated by HSPre. Cells were incubated with LysoTracker® Green DND-26 (Invitrogen) probes that were fluorescent acidotropic probes for labelling and tracking acidic organelles (lysosome) in live cells. The lysosomal activity was photographed live on an Olympus BX41 fluorescent microscope. images were taken at 100 × magnification and scale bar represented 100 µm (A). Cells with lysosomal activation per field were counted for at least three fields/sample, and the average number of cells per field is shown in (B). Data were independently performed three times. †p < 0.05 in comparison with NC. ‡p < 0.05 in comparison with HI. #p < 0.05 in comparison with HSPre + HI. Please see the legends of for group abbreviation.