Figures & data
Figure 1. Schematic sketch of the experimental set-up. HCC cell lines were plated in well plates and exposed to temperatures between 45–60 °C for 0.5 to 32 min. After heating, cell viability was determined by tetrazolium-based (MTS) assay.
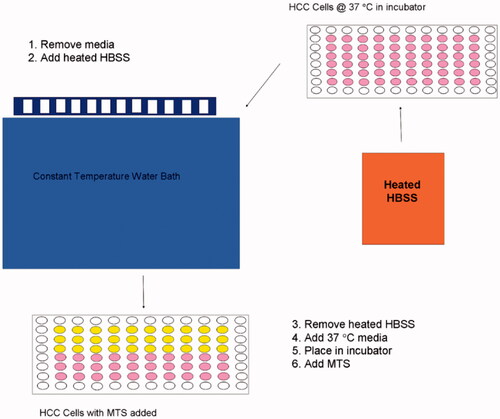
Figure 2. Temperature variations of the experiments recorded over 32 min. An initial decrease (time <3 min) was noted due to the media addition in the assay. Error bars indicate the standard deviation.
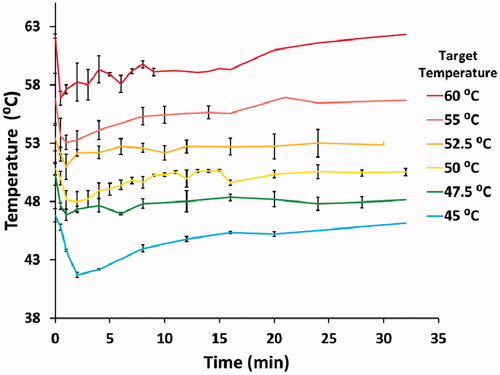
Figure 3. Survival fraction as a function of temperature and exposure time. The error bars indicate ± standard error of mean.
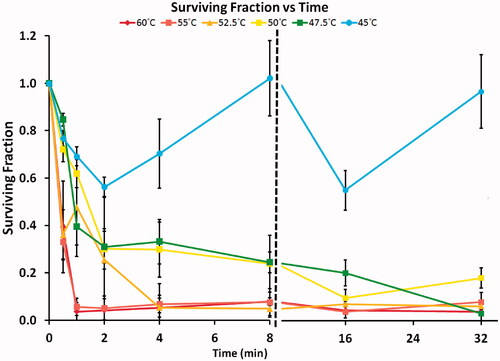
Figure 4. Points show the measured surviving fraction based on a tetrazolium survival assay. Solid line: prediction of surviving fraction via Arrhenius model for heating 0–10 min. Note: The sigmoidal shape of the 45 °C curve is due to considerable temperature variation within the first 10 min (see ).
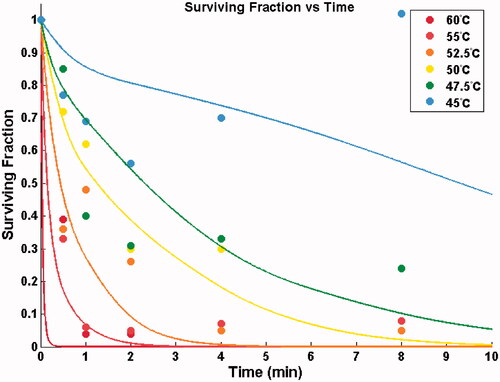
Table 1. Fitted Arrhenius parameters as well as compensation factor (R) derived from the fitted model parameters compared with prior R values.