Figures & data
Figure 1. Results of CRCL preparation, scheme for peptide separation, and reverse-phase high pressure liquid chromatography (rpHPLC) of peptides. (A) Coomassie Blue stained gel (top) showing total protein profile of fractions 4–16 of a Rotofor separation of 12B1 tumour proteins. Fraction numbers are listed at the top, and beneath the gel is the pH range of those fractions. Molecular weight markers (in kDa) are indicated on the left. The bottom portion shows western blots for the chaperones GRP94, Hsp90, Hsp70, and calreticulin (CRT). Vertical lines depict the fractions chosen to pool to generate CRCL (i.e. fractions 10–13). (B) shows a schematic of the procedure to strip peptides from CRCL (peptides represented by red dots) and their collection and separation away from the bulk of the proteins by centrifugation thru a 3-kDa cut-off membrane. (C) A chromatogram of peptides fractionated by C18 rpHPLC detected by absorbance readings at 214 nm, following elution with a 0–30% gradient of solvent B (0.1% TFA in ACN) over 30 min with a 30–95% gradient over the last 10 min (red trace). Fractions were collected every minute, and were combined into six pools (fractions 1–6, 7–13, 14–20, 21–26, 27–33, 34–40) with each pool subjected to mass spectrometry for peptide identification.
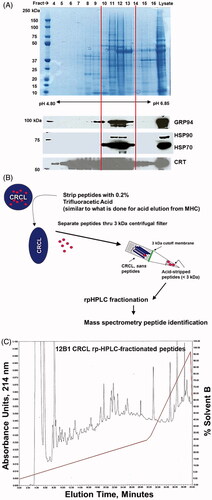
Figure 2. Ingenuity Pathway Analysis (IPA) and gene/protein ontology of CRCL peptides and their parent proteins. Peptides (and thus, proteins) identified by mass spectrometry were grouped by subcellular location (A) and function (B), and as a percentage of the total peptides categorised. (C and D) show the two high-scoring ‘top networks’ categorised by IPA in the form of interactomes; the network in C is Cellular movement, Cellular assembly and organisation, Cellular function and maintenance, with a score of 43, and 20 focus molecules. The network in D is Amino acid metabolism, Drug metabolism, Molecular transport, with a score of 24, and 13 focus molecules. The ‘scores’ (−log (p values)) reflect the probabilities of such associations occurring by chance (significance threshold set at 1.25), and ‘focus molecules’ are nodes for initiating networks. Peptides/proteins identified are shown in large red font with a yellow background. Interactions are depicted by lines (‘edges’), as described in the text.
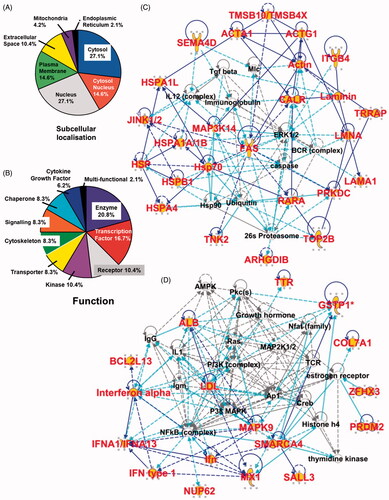
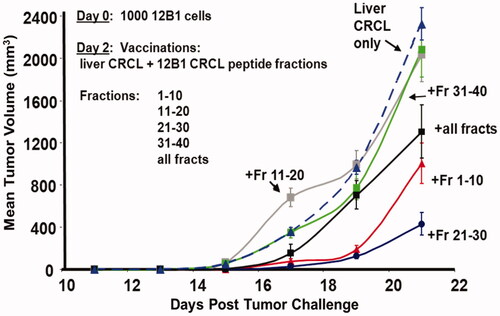
Figure 3. Reconstitution of liver CRCL with fractionated 12B1 CRCL peptides yields vaccines with anti-tumour activity. Mice were injected subcutaneously (s.c.) with 1000 in vivo passaged 12B1 tumour cells (LD100) on day 0. On day 2, mice were injected s.c. with ‘empty’ liver CRCL (25 µg/injection in 100 µL of PBS), or with liver CRCL + fractionated peptides (CRCL + pools of fractions 1–10, 11–20, 21–30, or 31–40). One group’s vaccine consisted of all the peptide fractions combined and mixed with liver CRCL as described. Tumour growth was measured every other day with calipers along two axes to determine volume; averages of four mice are shown per curve, with error bars = SEM. CRCL + fractions 1–10 and 21–30 differed significantly from all other groups by day 19; CRCL + all fractions was significantly different from liver CRCL, CRCL + fractions 11–20, and CRCL + fractions 31–40, by day 21 (ANOVA). These data are typical of two experiments.