Figures & data
Figure 1. HRTEM micrographs of nanoparticles obtained by thermal decomposition controlling the size by seed-growth (showing strains responsible for lowering the magnetisation. Reproduced with permission from Levy et al. [Citation37]).
![Figure 1. HRTEM micrographs of nanoparticles obtained by thermal decomposition controlling the size by seed-growth (showing strains responsible for lowering the magnetisation. Reproduced with permission from Levy et al. [Citation37]).](/cms/asset/66dd276a-beeb-4f38-8618-7e88c40bfcbb/ihyt_a_826824_f0001_b.jpg)
Figure 2. HRTEM and TEM micrographs of nanoparticles obtained by thermal decomposition, modifying surfactant concentration and reaction time (reproduced with permission of the Royal Society of Chemistry from Salas et al. [Citation39]).
![Figure 2. HRTEM and TEM micrographs of nanoparticles obtained by thermal decomposition, modifying surfactant concentration and reaction time (reproduced with permission of the Royal Society of Chemistry from Salas et al. [Citation39]).](/cms/asset/49a548e2-59b4-4afc-bb00-ffed6da45309/ihyt_a_826824_f0002_b.jpg)
Figure 3. (A) Comparison between the experimental SAR values (W/g Fe) of nanoparticles of different sizes obtained by three different synthetic approaches: 1) co-precipitation in water followed by a size selection process (□, 31 mT, 700 kHz) [Citation42], 2) thermal decomposition in organic medium (○, 30 mT, 700 kHz; •, 26 mT, 700 kHz) [Citation41], 3) thermal decomposition in organic medium followed by seed growth (+, 26 mT–700 kHz) [Citation37]. (B) Evolution of SAR (f = 54 kHz) as a function of magnetic field amplitude for two samples of different sizes (data extracted from Mehdaoui et al. [Citation49]). (C) Illustration of three different samples (S1, S2 and S3) with different sizes and size distributions and how the optimum frequency (f1, f2 and f3) for the maximum SAR is affected.
![Figure 3. (A) Comparison between the experimental SAR values (W/g Fe) of nanoparticles of different sizes obtained by three different synthetic approaches: 1) co-precipitation in water followed by a size selection process (□, 31 mT, 700 kHz) [Citation42], 2) thermal decomposition in organic medium (○, 30 mT, 700 kHz; •, 26 mT, 700 kHz) [Citation41], 3) thermal decomposition in organic medium followed by seed growth (+, 26 mT–700 kHz) [Citation37]. (B) Evolution of SAR (f = 54 kHz) as a function of magnetic field amplitude for two samples of different sizes (data extracted from Mehdaoui et al. [Citation49]). (C) Illustration of three different samples (S1, S2 and S3) with different sizes and size distributions and how the optimum frequency (f1, f2 and f3) for the maximum SAR is affected.](/cms/asset/adf9e3b1-cb7c-4372-8a12-2eda6c0c99e4/ihyt_a_826824_f0003_b.jpg)
Figure 4. Difference in SAR values (50 mT, 77 kHz) between two samples synthesised by thermal decomposition in 1-octadecene, with the same mean size but different size distribution. Scale bars = 50 nm.
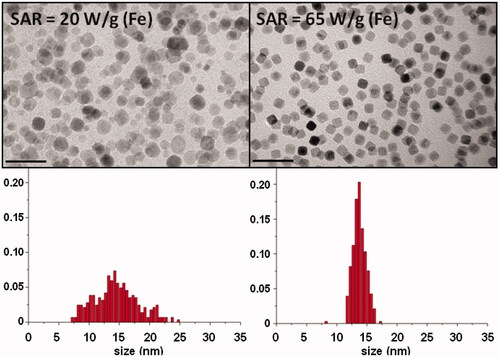
Figure 5. Difference in SAR values between two samples with similar mean size but different shape [Citation33].
![Figure 5. Difference in SAR values between two samples with similar mean size but different shape [Citation33].](/cms/asset/86c507de-d5f6-4d97-9e61-bdc1746e4057/ihyt_a_826824_f0005_b.jpg)
Figure 6. SAR values for nanoflowers (solid, hollow and crossed circles correspond to particles synthesised at different experimental conditions) and nanocubes (solid squares), under similar field conditions. TEM micrographs adapted with permission from Guardia et al. [Citation41] and Hugounenq et al. [Citation55].
![Figure 6. SAR values for nanoflowers (solid, hollow and crossed circles correspond to particles synthesised at different experimental conditions) and nanocubes (solid squares), under similar field conditions. TEM micrographs adapted with permission from Guardia et al. [Citation41] and Hugounenq et al. [Citation55].](/cms/asset/c68557c8-8488-409f-932c-9346f289695d/ihyt_a_826824_f0006_b.jpg)
Figure 7. Cartoon illustrating the effect of concentration on individual particles and aggregates.
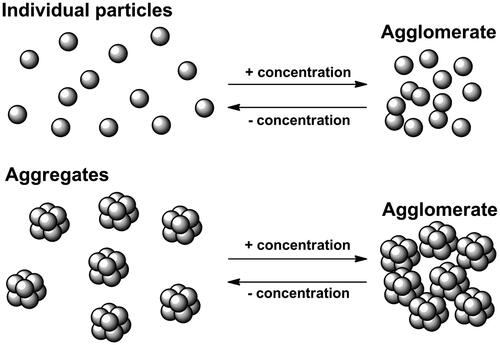
Figure 8. SAR (W/g Fe) versus concentration of MNPs of various sizes (concentration scale is logarithmic). Full circles: 30 nm (249 kHz, 12.5 mT) [Citation68]. Empty circles, squares and triangles: 13, 11 and 8 nm, respectively (522.7 kHz, 9.4 mT) [Citation69].
![Figure 8. SAR (W/g Fe) versus concentration of MNPs of various sizes (concentration scale is logarithmic). Full circles: 30 nm (249 kHz, 12.5 mT) [Citation68]. Empty circles, squares and triangles: 13, 11 and 8 nm, respectively (522.7 kHz, 9.4 mT) [Citation69].](/cms/asset/5e37315c-0b5f-41cf-8eeb-36f96738377b/ihyt_a_826824_f0008_b.jpg)