Figures & data
Figure 1. Histogram on AMF parameters of research groups measuring SAR from calorimetric or magnetic methods. The height of each column represents the number of research groups that have at least one publication between 2000 and 2012 measuring the SAR at the values of f and H0 corresponding to the position of the column in the horizontal plane. For example, the column at the position (200 kHz, 3 kA/m) accounts for all the groups using 200–299 kHz and 3–3.9 kA/m. In the central insets, the columns corresponding to the biological range as defined in Atkinson et al. [Citation35] are displayed in white, while the rest are displayed in blue.
![Figure 1. Histogram on AMF parameters of research groups measuring SAR from calorimetric or magnetic methods. The height of each column represents the number of research groups that have at least one publication between 2000 and 2012 measuring the SAR at the values of f and H0 corresponding to the position of the column in the horizontal plane. For example, the column at the position (200 kHz, 3 kA/m) accounts for all the groups using 200–299 kHz and 3–3.9 kA/m. In the central insets, the columns corresponding to the biological range as defined in Atkinson et al. [Citation35] are displayed in white, while the rest are displayed in blue.](/cms/asset/157b0408-987a-4e31-a769-3ca16e1d242c/ihyt_a_826825_f0001_b.jpg)
Figure 2. SAR determination by calorimetric methods in non-adiabatic isoperibol conditions: (A) SAR calculation by the initial-slope (β) method, (B) scheme of a typical experimental set-up, (C) SAR calculation using the parameters ΔTmax (maximum temperature increment) and τ (relaxation time) obtained from the fit of the complete T-vs-t curve to the exponential trend characteristic of isoperibol conditions.
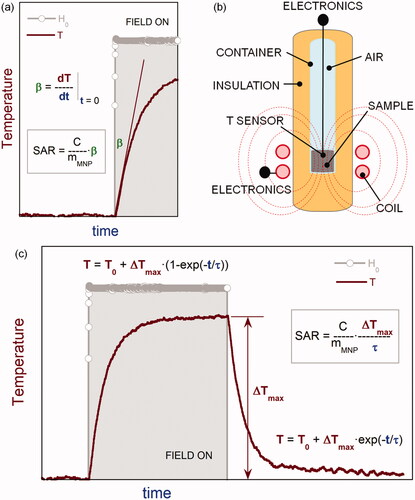
Figure 3. SAR determination by the pulse-heating method in adiabatic conditions: (A) T-vs-t trend in perfect (p) and imperfect (i) adiabatic conditions; (B) calculation of ΔT and SAR, in imperfect adiabatic conditions at different temperatures, using the T-vs-t trend resulting from the application of successive alternating magnetic field pulses, which allows determination of SAR in function of temperature, and (C) scheme of the experimental set-up reported in Natividad et al. [Citation30].
![Figure 3. SAR determination by the pulse-heating method in adiabatic conditions: (A) T-vs-t trend in perfect (p) and imperfect (i) adiabatic conditions; (B) calculation of ΔT and SAR, in imperfect adiabatic conditions at different temperatures, using the T-vs-t trend resulting from the application of successive alternating magnetic field pulses, which allows determination of SAR in function of temperature, and (C) scheme of the experimental set-up reported in Natividad et al. [Citation30].](/cms/asset/9a1d0f12-f1ea-4d2e-9f84-cf097634f54f/ihyt_a_826825_f0003_b.jpg)