Figures & data
Table I. Baseline characteristics of study population about artificial pleural effusion.
Figure 1. Flow chart summarising patient selection for the study.
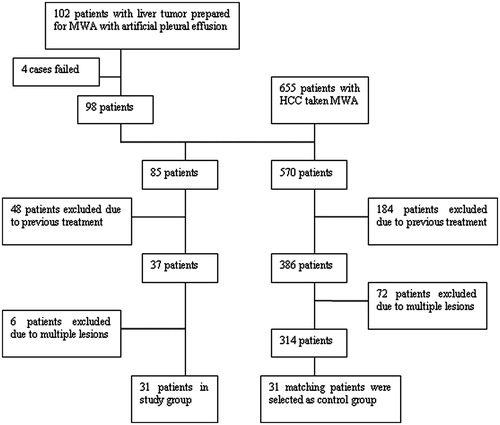
Table II. Baseline characteristics of patients in the two groups.
Figure 2. Images of a 58-year-old man with a 1.8-cm HCC treated by percutaneous MWA with artificial pleural effusion. (a) Contrast-enhanced sonogram showing the hyper-enhancing neoplasm (large arrow) clearly with the artificial pleural effusion (thin arrows) as acoustic window. (b) Sonogram showing the procedure of microwave ablation. Note microwave antenna in index tumour (large arrow) and artificial pleural effusion (thin arrows). (c) Coronal preablation contrast-enhanced MR image shows the hypointense neoplasm in delayed phase (arrows). (d) Coronal contrast-enhanced MR image 1 month after MWA shows the ablation zone (arrows).
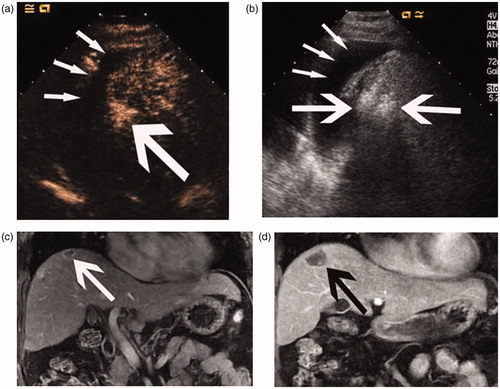
Figure 3. Images of a 48-year-old man with a 2.2-cm HCC treated by percutaneous MWA with artificial pleural effusion. (a) Sonogram shows the puncture of the pleural cavity. Note the 16-gauge BD Angiocath needle (arrow). (b) Sonogram shows the hypo-echoic nodule (large arrow) with the artificial pleural effusion (thin arrows). (c) Transverse preablation contrast-enhanced MR image shows the hyperintense neoplasm (arrows) located in the hepatic dome. (d) Transverse arterial phase MR image 1 month after MWA shows no enhancement in the ablation zone (arrow).
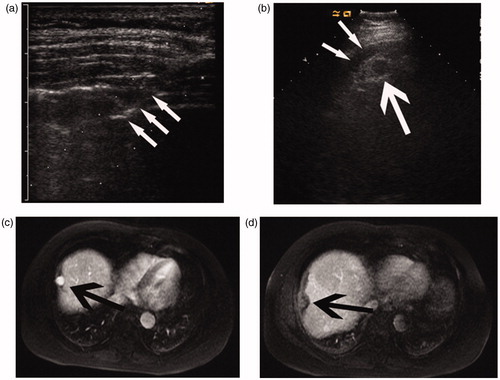
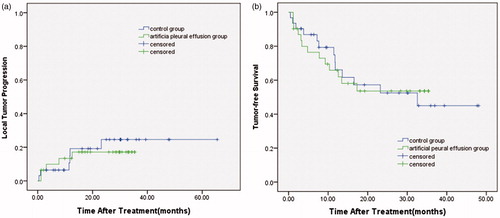
Figure 4. (a) Local tumour progression and (b) Tumour-free survival for the artificial pleural effusion group and the control group.