Figures & data
Figure 1. Induction coil chamber and power supply of a small animal magnetic field hyperthermia system (Actium Biosystems) with thermal monitoring and control console.
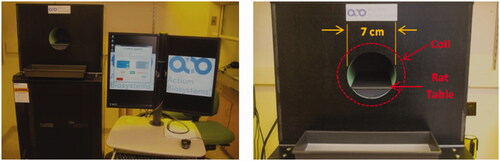
Figure 2. Specific loss power (SLP) as a function of magnetic field strength for 0.4 mL of 100 mg/mL magnetite nanoparticle solution at a fixed frequency of 40 kHz. The dashed line represents the best fit line to H2-law (R2 = 0.98).
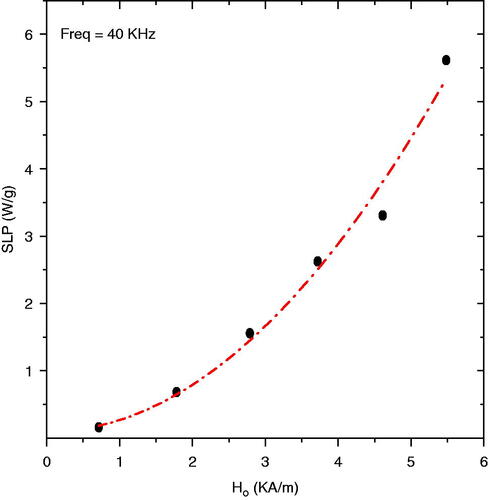
Figure 3. Pretreatment MRI image showing the rat bladder filled with 0.5 mL of 0.5 mg/mL magnetic fluid. Arrows highlight the catheter placement through the urethra to the bladder.
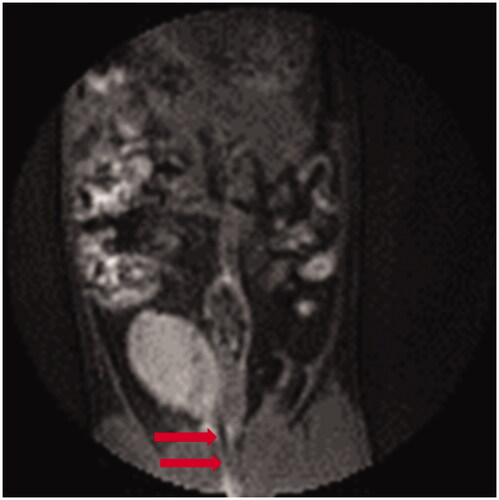
Figure 4. Non-specific heating of rat tissues from exposure to 5.3 kA/m magnetic field at 40 kHz with 0.4 mL saline instilled into the bladder. A slow temperature rise of rat tissues follows the overall increase in air temperature inside the coil.
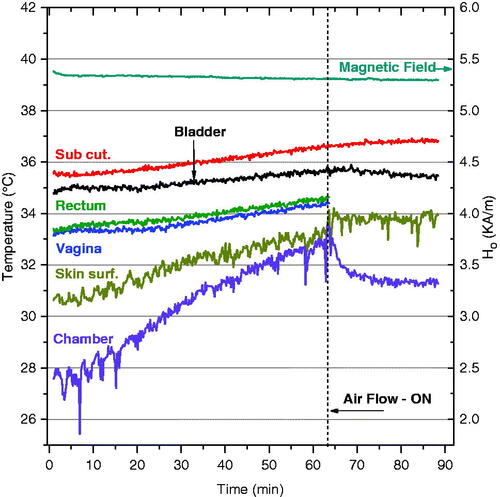
Figure 5. Amplitude of contrast-enhacement in the kidneys as a function of Gd-DTPA volume injected into the rat bladder. The bladder volume was determined by manual segmentation of the MR images as verification of the injected volumes.
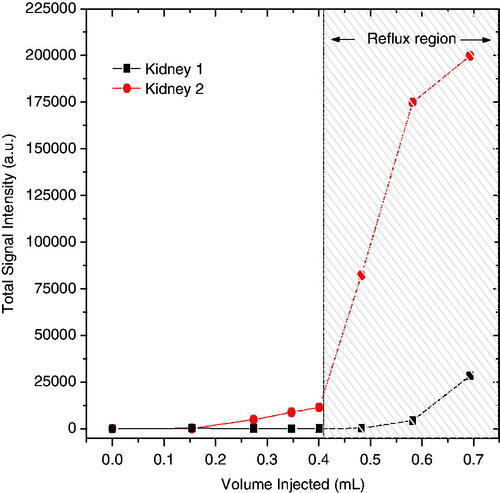
Figure 6. Temperatures achieved inside the rat bladder following exposure to 5.5 kA/m magnetic field at 40 kHz. (A) representative heating rate profiles for four different rats injected with 0.4 mL of a range of magnetite concentrations (25–100 mg/mL), and (B) bladder temperatures achieved after 15 min of heating as a function of magnetite concentration. The bars represent the maximum and minimum values obtained in at least three animals per data point.
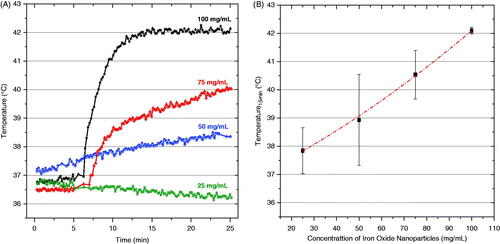
Figure 7. Temperatures achieved inside the rat bladder after exposure to 5.5 kA/m magnetic field at 40 kHz. (A) representative heating rate profiles for three different rats injected with different volumes of 100 mg/mL magnetite nanoparticles, and (B) bladder temperatures achieved after 15 min of heating as a function of injected volume. The bars represent the maximum and minimum values obtained in at least three rats per data point.
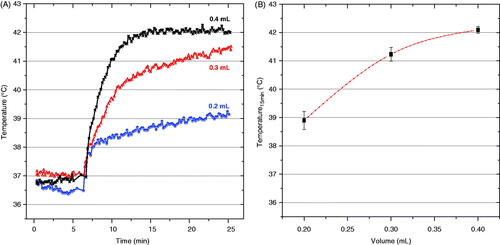
Figure 8. Typical magnetic field amplitude (red line, right axis) applied during MFH treatment (0.4 mL of 100 mg/mL nanoparticles) required to achieve the goal temperature of 42 °C inside the rat bladder (black line, left axis).
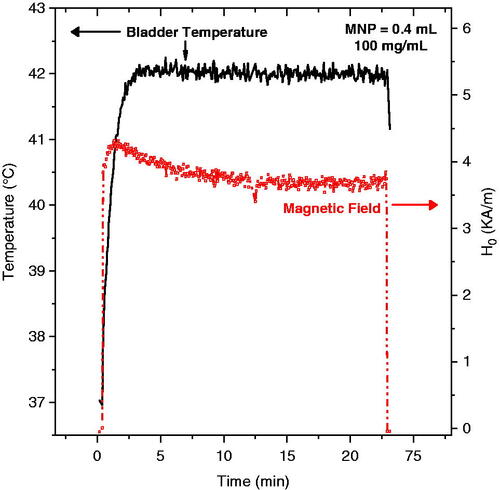
Figure 9. Average temperature obtained in five rats during 1 h MFH treatment. Note the excellent localisation of heat in the bladder target and lower temperatures in surrounding normal tissues such as the vagina (blue) and other body sites (black). The ‘body temperature’ curve (black) represents the average of measurements from subcutaneous, rectal and oral probes which were similarly low compared to the bladder temperature. The nanoparticle concentration for all treatments was 100 mg/mL.
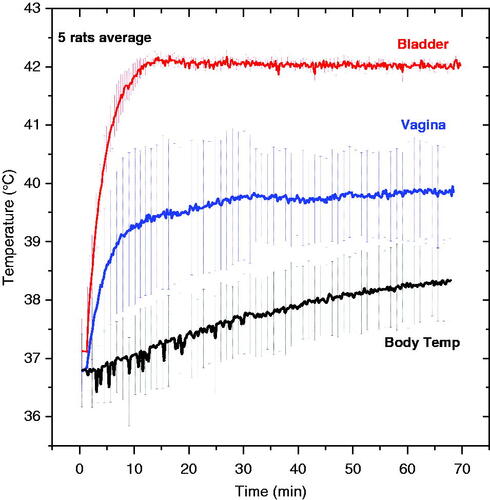
Table I. Steady state temperatures achieved at all monitored sites in five rats heated to 42 °C in bladder (with standard deviations in parentheses).