Figures & data
Figure 1. HH-CO2 inhibits colon cancer cell proliferation and induces apoptosis. Temperature- and time-dependent effects of HH-CO2 on COLO 205 and HCT 116 cell proliferation. (B) Flow cytometry-based Annexin V FITC PI labelling of apoptotic cells. (C) Histograms showing apoptosis rates. Each data point represents the mean ± SD from three independent experiments. *p < 0.05 versus control.
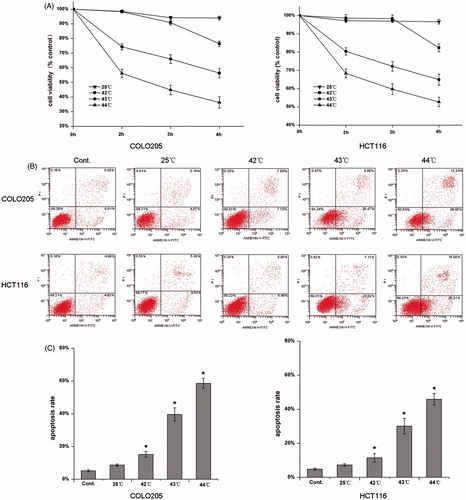
Figure 2. Effect of HH-CO2 on Bcl-2 and Bax expression. The expressions of Bcl-2 and Bax in COLO 205 and HCT 116 cells were assessed by western blotting. (B) Histograms showing the expressions of Bcl-2 and Bax relative to that of β-actin. Each data point represents the mean ± SD from three independent experiments. *p < 0.05 versus control.
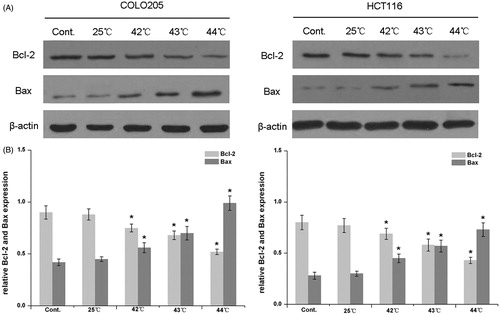
Figure 3. HH-CO2 inhibits monolayer wound healing of colon cancer cells. (A) Phase micrographs of COLO 205 and HCT 116 cells at various times after monolayer wounding (100× original magnification). (B) Quantification of COLO 205 and HCT 116 cell migration using the monolayer wound healing assay. Each data point represents the mean ± SD from three independent experiments. *p < 0.05 versus control.
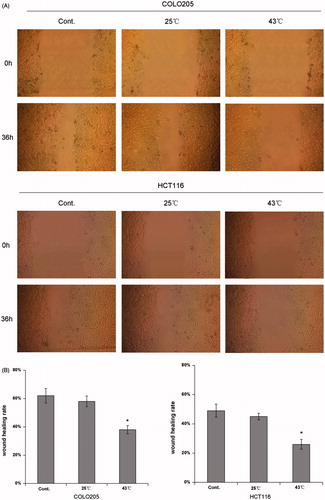
Figure 4. HH-CO2 inhibits colon cancer cell invasion. (A) Phase micrograph of invading COLO 205 and HCT 116 cells. COLO 205 and HCT 116 cells were treated with HH-CO2 at 42 °C, 43 °C, 44 °C for 3 h. Invading cells were fixed with methanol and stained with crystal violet and photographed at 200× magnification. (B) Quantification of cell invasion shown in (A). Each data point represents the mean ± SD from three independent experiments. *p < 0.05 versus control.
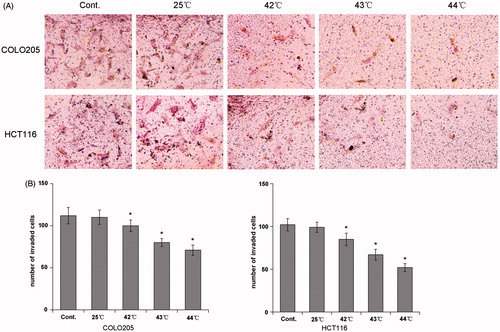
Figure 5. HH-CO2 inhibits MMP-2 expression in colon cancer cells. (A) MMP-2 expression in COLO 205 and HCT 116 cells was detected by western blotting. β-actin was used as the loading control. (B) Histograms showing the expression of MMP-2 relative to that of β-actin. Each data point represents the mean ± SD from three independent experiments. *p < 0.05 versus control.
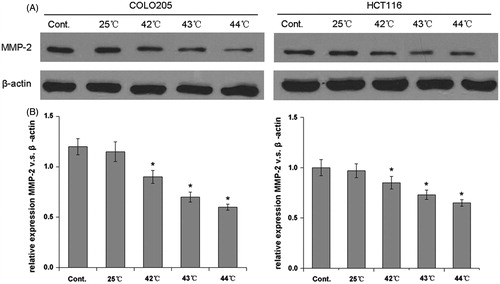
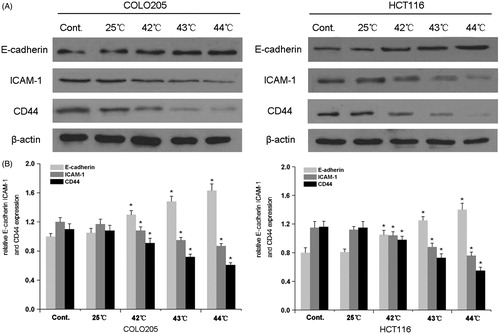
Figure 6. Effect of HH-CO2 on the expression of adhesion molecules. E-cadherin, ICAM-1 and CD44 expressions in COLO 205 and HCT 116 cells were detected by western blot analysis. (B) Histograms showing the expression of E-cadherin, ICAM-1 and CD44 relative to that of β-actin. Each data point represents the mean ± SD from three independent experiments. *p < 0.05 versus control.