
Figures & data
Figure 1. Experimental approach. (A) The drawing shows the position of the needle for fluid injection, the thermal sensor, the RF electrode, and the target zone before RF ablation. (B) The drawing shows the distribution of the solution injected subcutaneously, the position of the needle for injection, the thermal sensor, the RF electrode, and the ablative zone during the ablative procedure (35 × 34 mm, 300 × 300 dpi).
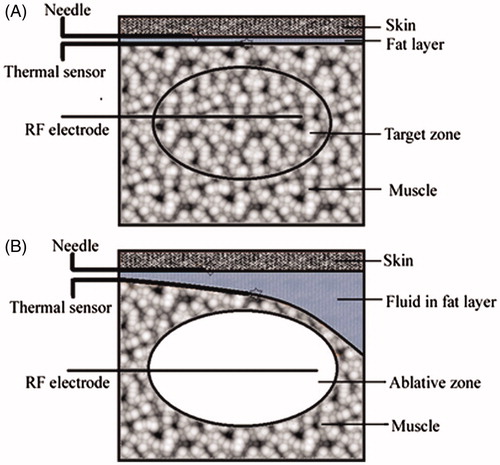
Figure 2. Ultrasonography during the RF ablative procedure. Representative images of grey-scale ultrasonography during the RF ablative procedure. (A) The position of the ablative zone and the thermal sensor. (B) The position of the ablative zone and the needle for injection. (C) Distribution of the solution injected in the pre-injection group. (D) Distribution of the solution injected in the perfusion group. The thermal sensor and the needle for injection are viewed as an echogenic line (red arrow). The ablative zone is viewed as an echogenic area (white arrow). The solution injected subcutaneously is viewed as a no-echo region (yellow arrow) with a significantly uneven distribution (54 × 50 mm, 300 × 300 dpi).
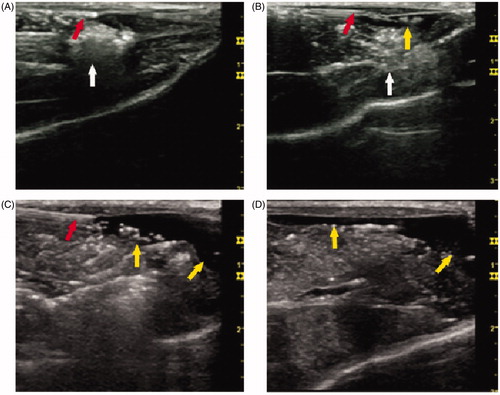
Table I. Temperature parameters during the RF ablative procedure.
Figure 3. Time–temperature curves during the RF ablative procedure. The graph shows the time–temperature curve of each group during the RF ablative procedure. Temperature data are presented as the means ± standard deviation (60 × 39 mm, 300 × 300 dpi).
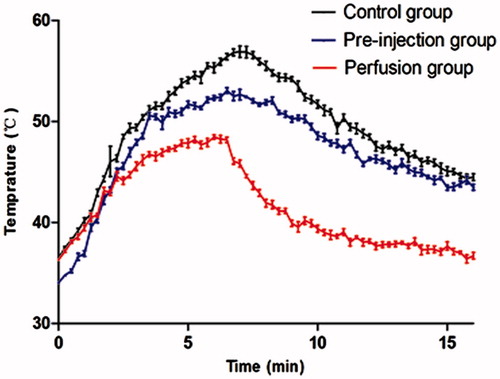
Figure 4. RF ablative zone detected by contrast-enhanced ultrasonography (CEUS). The representative image shows the ablative zone as a non-enhanced region (white arrow) during the post-procedure examination by CEUS. The ablative zone was located in the muscle abutting the skin (35 × 34 mm, 300 × 300 dpi).
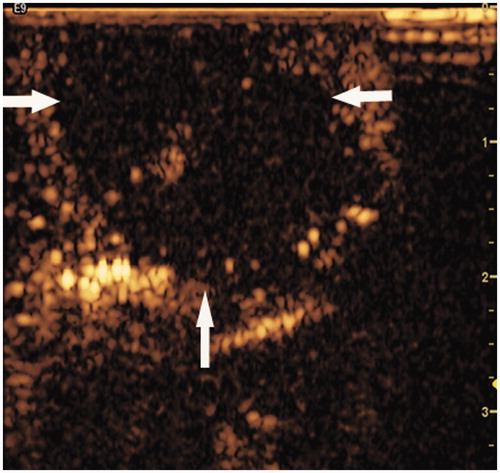
Table II. RF ablation area measurements.
Figure 5. Visual inspection of skin injuries on post-procedure day 1. Representative photographs of the gross skin injuries on post-procedure day 1. (A) Erythema in the perfusion group. (B) A vesicle in the pre-injection group. (C, D) Ulceration in the control group (54 × 50 mm, 300 × 300 dpi).
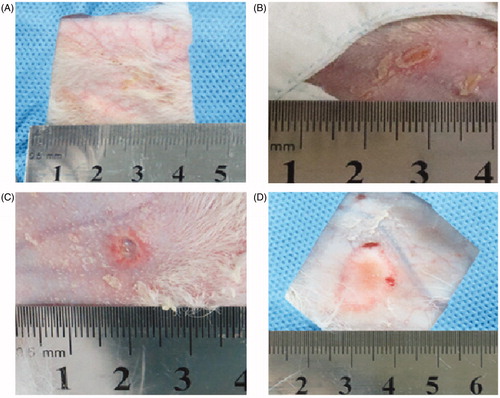
Table III. Visual inspection of skin injuries on post-procedure day 1.
Figure 6. Visual inspection of skin injuries on post-procedure day 14. Representative photographs of gross skin injuries on post-procedure day 14. (A) Pigmentation in the perfusion group. (B) Ulceration in the pre-injection group. (C, D) Ulceration in the control group (54 × 50 mm, 300 × 300 dpi).
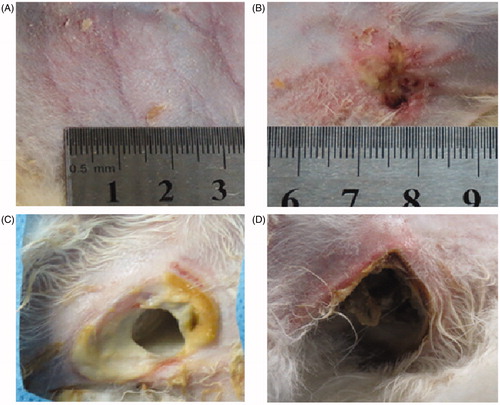
Table IV. Visual inspection of skin injuries on post-procedure day 14.