
Figures & data
Table I. Material properties of tissues.
Table II. Heat transfer coefficients and fluid temperatures for convective flow boundaries.
Figure 1. The geometry of the parametric simulations consisted of a 7.2 cm L, 11 cm OD cylinder with an applicator in the centre. The applicator consists of a series of transducers (black) mounted operated within a water-cooled catheter (purple). The tissues ablated could consist of only tumour tissue, tumour surrounded by bone, or tumour surrounded by bone surrounded by nerve tissue. There could also be a layer of carbon dioxide between the bone and nerve tissue. The temperature of a 1 cm long region of interest in the centre of the tumour was controlled to a maximum temperature Tc.
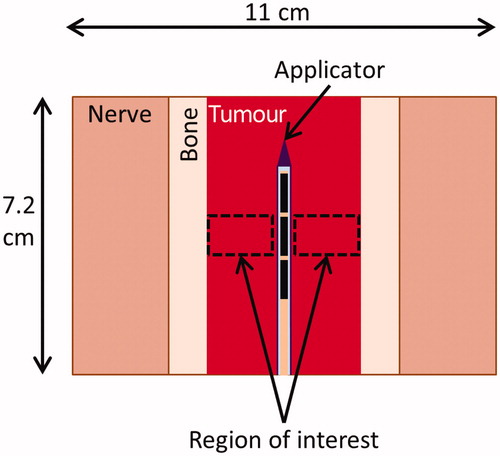
Table III. Treatment and geometric parameters for parametric studies.
Figure 2. Process by which patient-specific simulations are created. 3D anatomy in a CT scan is segmented and converted into 3D surface meshes. The surface meshes of the anatomy and of a cylinder representing the applicator are combined and then converted into a finite element method (FEM) mesh, on which temperature and thermal dose are calculated.
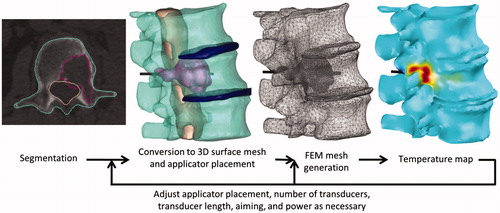
Table IV. Location, bone content, and size of tumours considered in patient-specific models.
Figure 3. The maximum diameter of tumour tissue that could be ablated in a given time frame was calculated for a variety of ultrasound attenuation coefficients, ablation durations, and control temperatures. Simulations with each tumour attenuation value and each control temperature were performed for ablation durations of 5 min (triangle), 10 min (bar), and 15 min (circle) in a homogenous tissue volume.
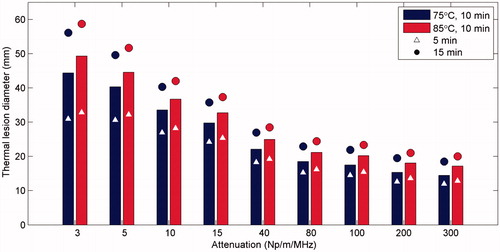
Figure 4. Summary of parametric studies of interstitial ultrasound ablation of a cylindrical tumour volume surrounded by bone: (A) The maximum bone temperature at the time ablation is completed, as a function of tumour diameter, for a variety of blood perfusion rates within the tumour and control temperatures. The mean acoustic intensity, averaged over time (B), and the time necessary (C) to thermally ablate a tumour surrounded by bone are also shown.
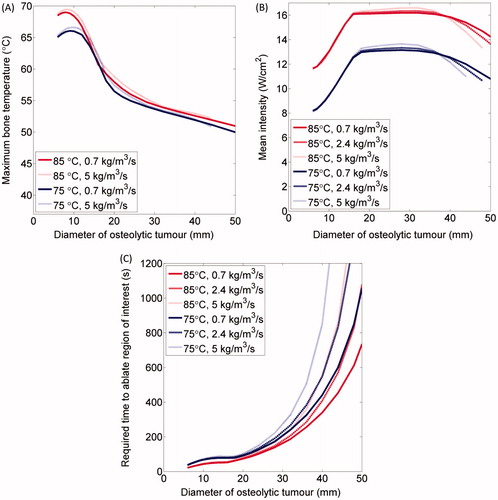
Figure 5. Summary of the maximum thermal dose to nerve tissue adjacent to normal bone encapsulating a tumour () after ablation of the tumour as a function of tumour diameter, bone thicknesses, and control temperature. Each tumour diameter and bone thickness was modelled with control temperatures of 85 °C (bar), 80 °C (circle), and 75 °C (triangle). A case with 2 mm of bone and a 2 mm layer of insulating CO2 gas was modelled and is shown for comparison. A safety threshold of 6 EM43 °C, below which no deleterious effects to nerves are expected, is delineated.
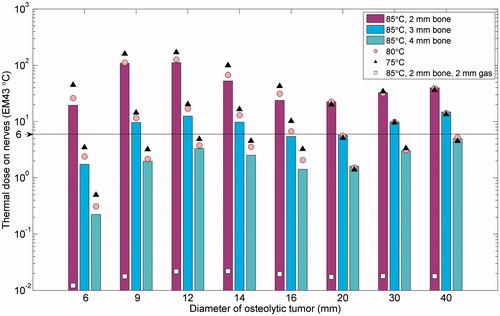
Figure 6. Three models of ablation of tumours not encapsulated by bone: adjacent to the cervical vertebrae C4 and C5 in case 1 (A, B), invading the left transverse process of T5 in case 2 (C, D), and invading the left transverse process of L3 in case 3 (E, F). The 240 (violet, inner dashed line) and 6 (crimson, outer dashed line) EM43 °C contours 10 min after treatment are shown atop a colour map of the temperature (°C) at the end of heating in axial slices through the applicator in A, C, and E. 3D temperature maps (°C) at the end of heating are shown on the tumour, bone, intervertebral disc, and spinal canal surfaces in B, D, and F. The position of the transducers, which are skew to the axial plane in A, are shown in grey in A, C, and E, with the whole applicator black in B, D, and F. The locations of the tumour (t), vertebrae (v), spinal canal (sc), intervertebral discs (d), ribs (r), and lung (lu) are indicated.
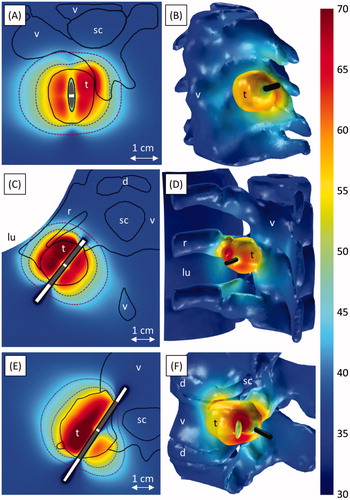
Figure 7. Ablation of a tumour invading the vertebral body and spinal canal at level L2. A-B and C-D respectively show ablation with (Case 4a) and without (Case 4b) carbon dioxide injection for tissue dissection and insulation. Colour maps show temperature (°C) 190 s into the ablation, before power is shut off to any of the transducers. A and C show temperature in an axial slice through the transducers (grey), with the 240 (violet, inner dashed line) and 6 (crimson, outer dashed line) EM43 °C contours 10 min after treatment superimposed. The applicator (black cylinder) and bone surface (black mesh) are shown in B and D. The locations of the tumour (t), vertebrae (v), spinal canal (sc), intervertebral discs (d), vena cava (vc), and carbon dioxide bubble (CO2) are indicated.
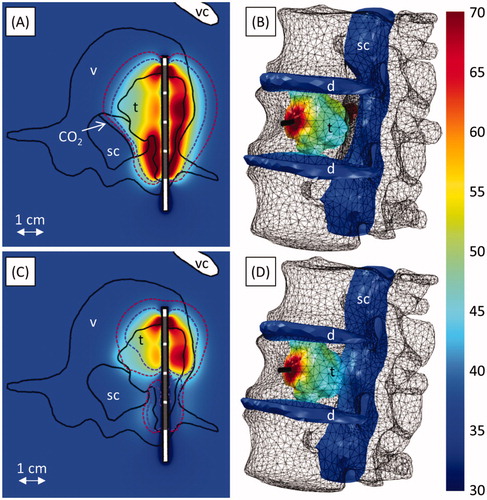
Figure 8. Ablation of narrow osteolytic tumours invading the vertebral bodies of C5 in case 5 (A, B) and L1 in case 6 (C, D). A and C show temperature (°C) at the end of heating in vertical slices through the applicator. The 240 (violet, inner dashed line) and 6 (crimson, outer dashed line) EM43 °C contours 10 minutes after treatment, as well as the transducer positions (grey), are also shown. The temperature (°C) on the spinal canal, intervertebral discs, and tumour at the end of heating is shown in B and D. A yellow cloud indicates the 240 EM43 °C contour surrounding the tumour (red) 10 min after treatment. The applicator (black cylinder) and bone surface (grey mesh) are also shown. The locations of the tumour (t), vertebrae (v), spinal canal (sc), and intervertebral discs (d) are indicated in the figures.
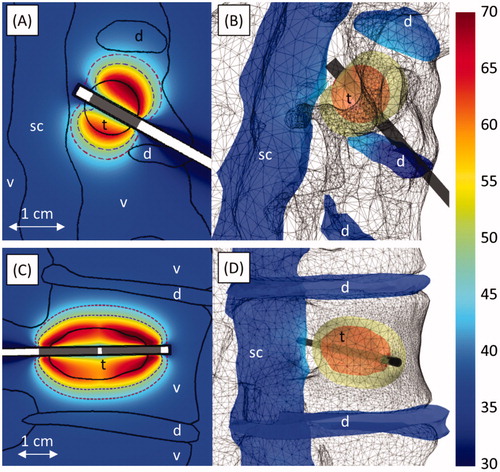
Figure 9. Ablation of an osteolytic tumour invading the anterior portion of the L1 vertebral body (case 7). (A) Temperature (°C) at the end of heating in an axial slice through the applicator. The 240 (violet, inner dashed line) and 6 (crimson, outer dashed line) EM43 °C contours 10 min after treatment, as well as transducer positions (grey) are also shown. (B) The temperature (°C) on the spinal canal, intervertebral discs, and tumour at the end of heating. The applicator (black cylinder) and bone surface (black mesh) are also shown. The locations of the tumour (t), vertebrae (v), spinal canal (sc), intervertebral discs (d), and aorta (ao) are indicated in the figures.
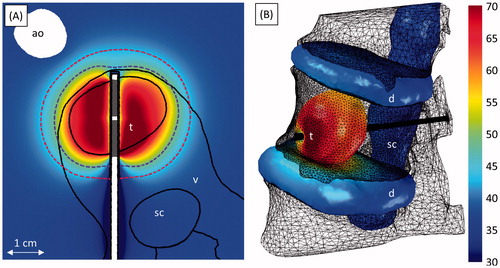
Figure 10. Ablation of tumours near the sacral nerves invading S1 (7 MHz) in case 8 (A–E) and the right iliac bone (3 and 7 MHz) in case 9 (F–H). A and F show the positions of the bones (turquoise), spinal canal (beige), tumour (violet), intervertebral discs (navy blue), and applicator (black). B–E, G, and H show temperature (°C) at a given time in axial slices through the applicator. The 240 (violet, inner dashed line) and 6 (crimson, outer dashed line) EM43 °C contours, as well as active transducer positions (grey), at the given time are also shown. The locations of the tumour (t), vertebrae (v), spinal canal (sc), spinal nerves (n), intervertebral discs (d), and ilium (i) are indicated in the figures.
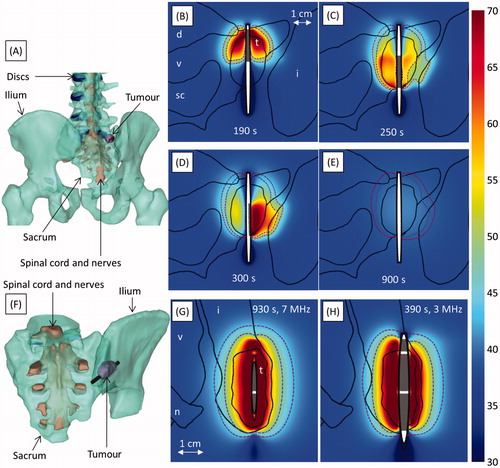
Table V. Treatment parameters and dosimetry results for patient-specific models.