
Figures & data
Figure 1. Schematic representation of the phenomena explaining the CT value dependence on tissue temperature.
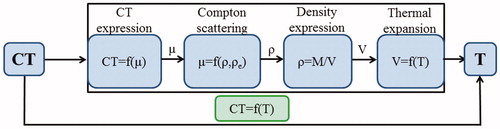
Figure 2. (A) Water calibration phantom, (B) CT-slice of the water phantom, (C) histograms of the CT values of water equivalent phantoms at two different temperatures (T2 > T1).
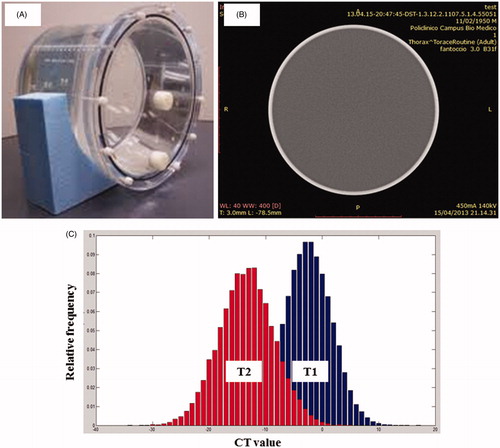
Figure 3. CT number dependence on temperature of water. (A) Trend of CT value with temperature of distilled water phantom and parabolic curve fitting, adapted from [Citation29], (B) trend of CT value with temperature of water, adapted from [Citation18], (C) trend of CT value with temperature of water and linear fitting, adapted from [Citation22], (D) trend of CT value with temperature of different materials and linear fittings, adapted from [Citation26].
![Figure 3. CT number dependence on temperature of water. (A) Trend of CT value with temperature of distilled water phantom and parabolic curve fitting, adapted from [Citation29], (B) trend of CT value with temperature of water, adapted from [Citation18], (C) trend of CT value with temperature of water and linear fitting, adapted from [Citation22], (D) trend of CT value with temperature of different materials and linear fittings, adapted from [Citation26].](/cms/asset/0b82cb2f-83bc-4bff-85e4-0ee28e177eeb/ihyt_a_922221_f0003_b.jpg)
Table 1. Comparison between experimental parameters and results of different studies on water-equivalent phantoms.
Figure 4. Trend of CT number as a function of temperature of different ex-vivo tissues. (A) Ex vivo bovine liver undergoing radiofrequency ablation, adapted from [Citation37], (B) ex vivo bovine liver undergoing LITT, adapted from [Citation31], (C) ex vivo porcine pancreas undergoing LITT, adapted from [Citation20].
![Figure 4. Trend of CT number as a function of temperature of different ex-vivo tissues. (A) Ex vivo bovine liver undergoing radiofrequency ablation, adapted from [Citation37], (B) ex vivo bovine liver undergoing LITT, adapted from [Citation31], (C) ex vivo porcine pancreas undergoing LITT, adapted from [Citation20].](/cms/asset/71b30e1b-9954-40c0-8c15-0c8a931e7e05/ihyt_a_922221_f0004_b.jpg)
Table 2. Comparison between experimental parameters and results of different studies on ex vivo and in-vivo tissues.