Figures & data
Figure 1. Experimental set-up.
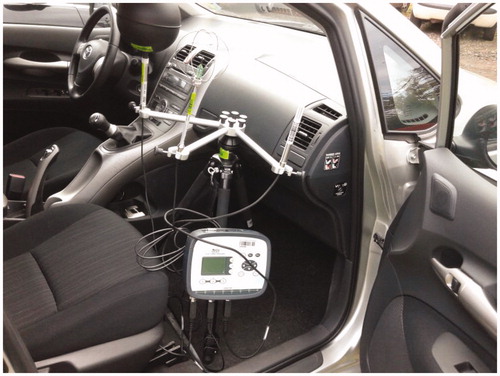
Figure 2. Time evolution of the air temperature in the vehicles, for all the 12 tests performed. Legend: test date (month_day).
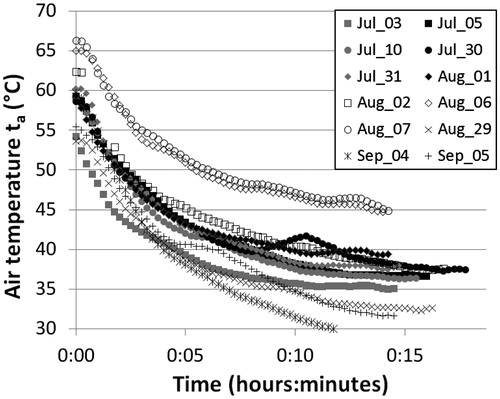
Table 1. Synthesis of test results: tout is the mean outdoor air temperature (measured), t0 is the initial air temperature inside the vehicle (measured), t∞ is the asymptotic air temperature, i.e. the limit temperature for time→∞, inside the vehicle (predicted), τ is the cooling timescale, σ is the r.m.s. of departures of the fit to the air temperatures inside the vehicle from experimental data.
Figure 3. Time evolution of the air temperature ta and the globe temperature tg in the vehicles, for four selected tests. Grey symbols: ta; black symbols: tg. Legend: test date (month_day).
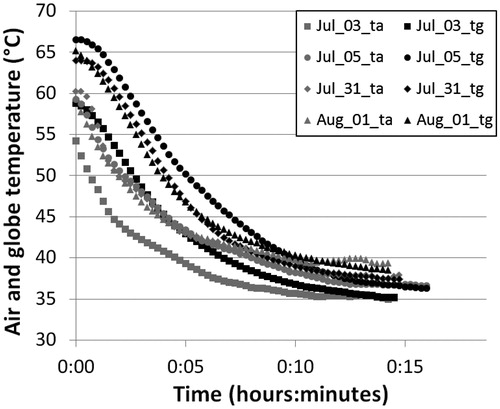
Figure 4. Time evolution of the relative humidity in the vehicles, for all the 12 tests performed. Legend: test date (month_day).
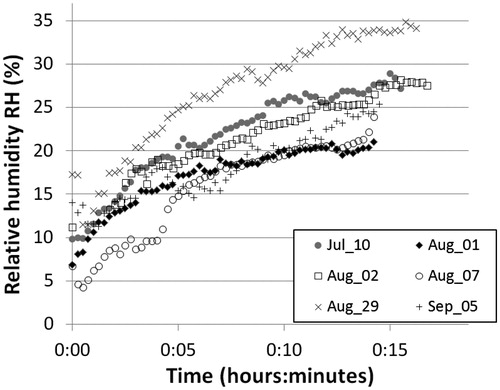
Figure 5. Time evolution of the driver’s core (rectal) temperature during the first sixty minutes of driving, as predicted by the thermal model. Legend: test date (month_day).
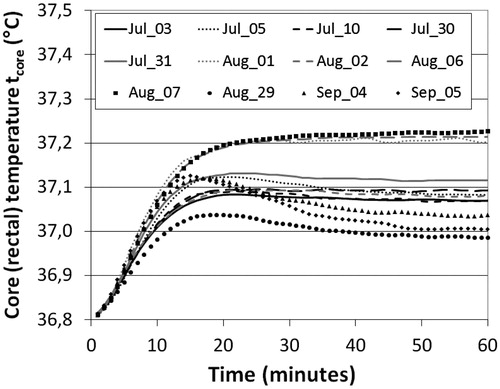
Figure 6. Predicted relative performance as a function of the driver’s core temperature. Solid curve: demanding tasks; dashed curve: simple tasks; dots: literature experimental data for office tasks [Citation25].
![Figure 6. Predicted relative performance as a function of the driver’s core temperature. Solid curve: demanding tasks; dashed curve: simple tasks; dots: literature experimental data for office tasks [Citation25].](/cms/asset/a3f04247-fd5f-4057-92f0-a57b6aa6fffe/ihyt_a_922222_f0006_b.jpg)
Table 2. Predicted relative performance in driving-related tasks during experimental tests: tout is the mean outdoor air temperature (measured), tcore the core (rectal) temperature after 60 minutes of driving (predicted). Performance is set equal to 1 under ideal thermal conditions.
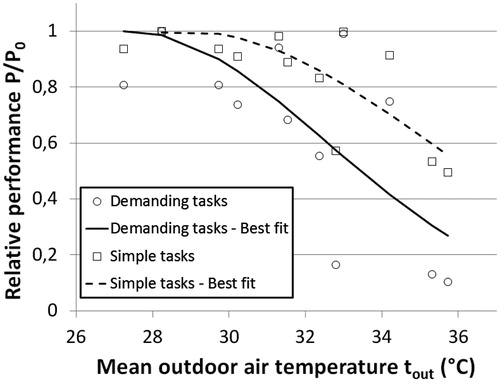
Figure 7. Predicted relative performance as a function of the outdoor air temperature. Circles: demanding tasks; squares: simple tasks. Solid curve: best fit for demanding tasks; dashed curve: best fit for simple tasks.