Figures & data
Figure 1. Storage modulus (a), loss modulus (b), (c) dependent on shear strain, storage and loss modulus and
dependent on temperature for γ = 0.001 and γ = 0.01.
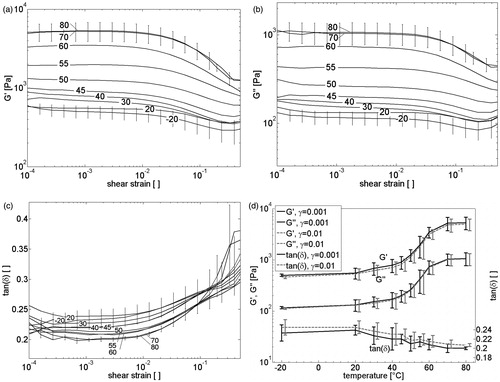
Figure 2. Storage modulus (a), loss modulus (b), and viscosity (c) dependent on frequency.
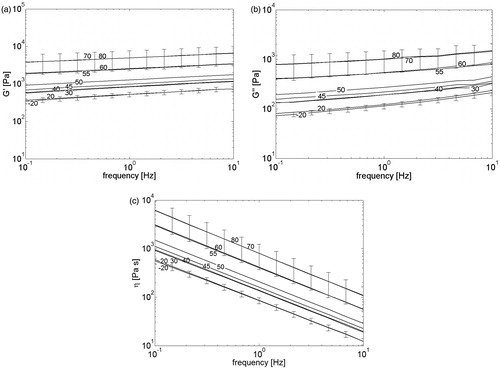
Figure 3. Mean complex modulus |G*| compared to results by the references [Citation14] and [Citation26].
![Figure 3. Mean complex modulus |G*| compared to results by the references [Citation14] and [Citation26].](/cms/asset/ba046e70-12c2-4775-9fa3-39846818a819/ihyt_a_924161_f0003_b.jpg)
Figure 4. Mean compared with reference [Citation26].
![Figure 4. Mean compared with reference [Citation26].](/cms/asset/a19d348b-cd98-4975-a30c-c5b67c1c79d7/ihyt_a_924161_f0004_b.jpg)
Figure 5. Master curves of |G*| shown for 5 specimen.
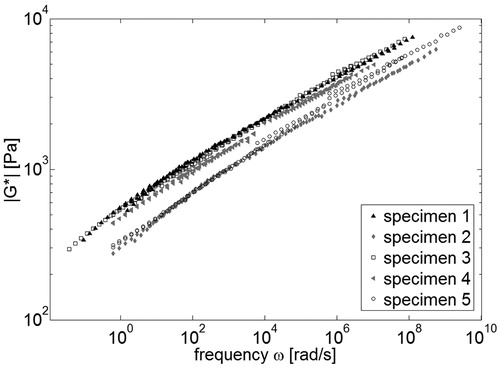
Figure 6. Mean of experimentally obtained shift factor and curve fit with two exponential equations.
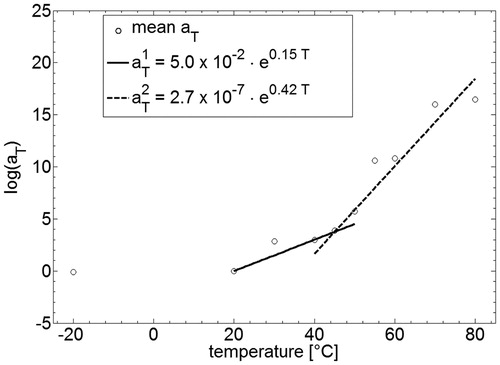
Figure 7. Flow curves and viscosity for varying preparation temperatures.
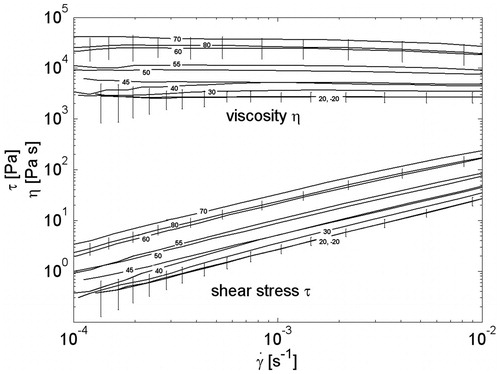
Figure 8. Shear stress and viscosity with increasing temperature and = 0.0001, 0.001 and 0.01 s−1.
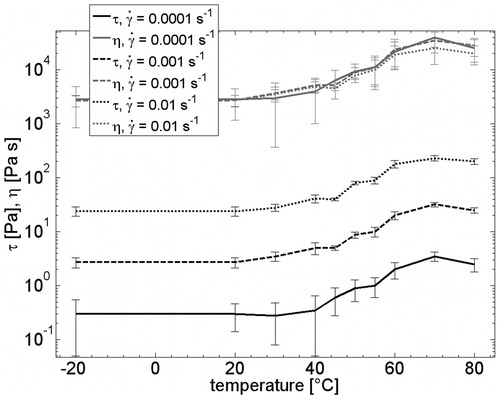
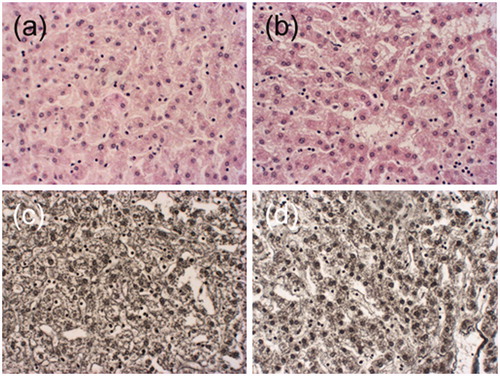
Figure 9. Liver parenchyma at preparation temperature 20 °C, (a) HE before mechanical testing, (b) HE after mechanical testing, (c) Gomori before mechanical testing, (d) Gomori after mechanical testing.
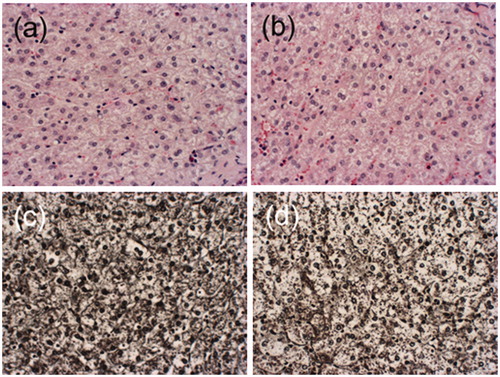
Figure 10. Liver parenchyma at preparation temperature 80 °C, (a) HE before mechanical testing, (b) HE after mechanical testing, (c) Gomori before mechanical testing, (d) Gomori after mechanical testing.
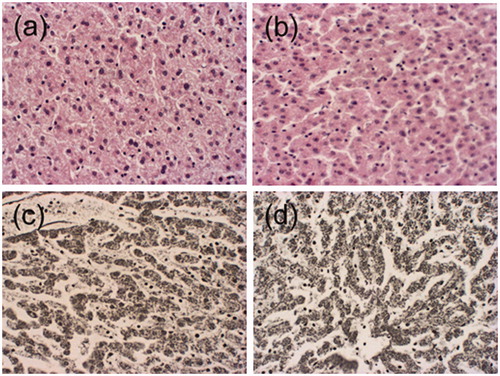
Figure 11. Liver parenchyma at preparation temperature −20 °C, (a) HE before mechanical testing, (b) HE after mechanical testing, (c) Gomori before mechanical testing, (d) Gomori after mechanical testing.