
Figures & data
Table 1. Kinetic coefficients for the three tissues of interest.
Figure 1. Human models with a spherical tumour embedded (indicated by the arrows) within them: (A) a simplistic model of two compartments, and three realistic anatomy models for (B) liver, (C) kidney, and (D) lungs. The active part of the electrode was placed into the tumour.
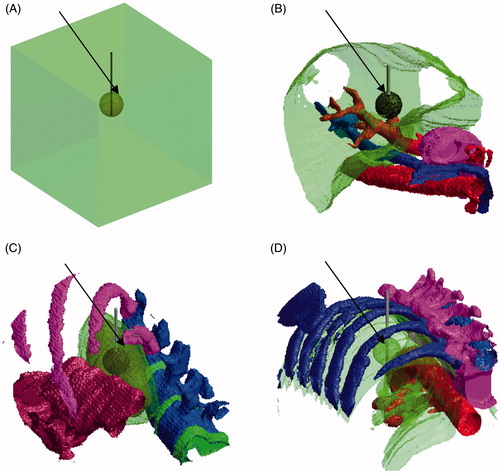
Table 2. Electric and thermal properties of background tissue (460 kHz).
Table 3. Electric and thermal properties of cancerous tissue (tumour volume).
Table 4. Comparison of numerical and experimental results for validation purposes.
Figure 2. Electric field intensity along a line through the active electrode for various edge sizes of the cubic computational domain (one-compartment model).
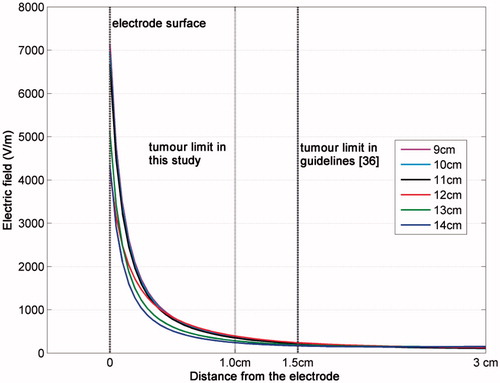
Table 5. Parameters used to characterise treatment efficiency (obtained numerically).
Figure 3. Profiles of the normalised temperature rise distribution along a line of the computational models of tumour tissue embedded in normal liver tissue. The line is at a distance of 0.5 cm below the electrode tip. (A) Two-compartmental liver model (maximum ΔT = 0.63 °C). (B) Realistic geometry (maximum ΔT = 2.24 °C).
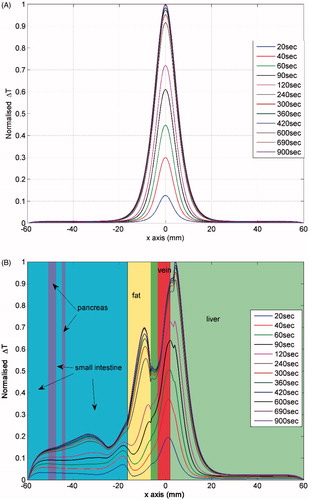
Figure 4. Profiles of the normalised temperature rise distribution along a line of the computational models of tumour embedded in normal kidney tissue. The line is at a distance of about 1 cm and parallel to the electrode. (A) Two-compartmental kidney model (maximum ΔT = 2.43 °C). (B) Realistic geometry (maximum ΔT = 2.04 °C).
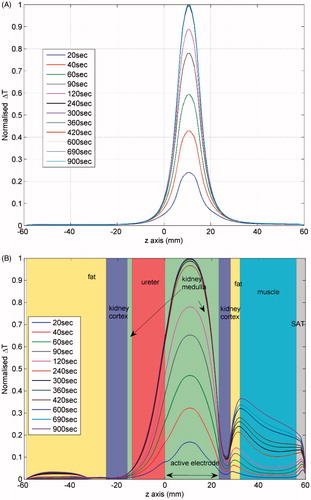
Figure 5. Temperature rise in a voxel 1 cm away from the electrode on a plane normal to the middle of its active part.
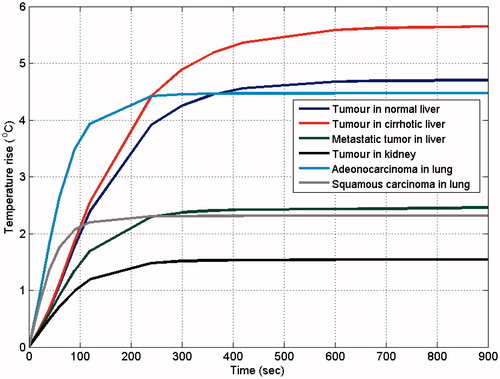
Table 6. Numerically calculated and analytically approximated thermal results.