Figures & data
Figure 1. The geometry of the problem.
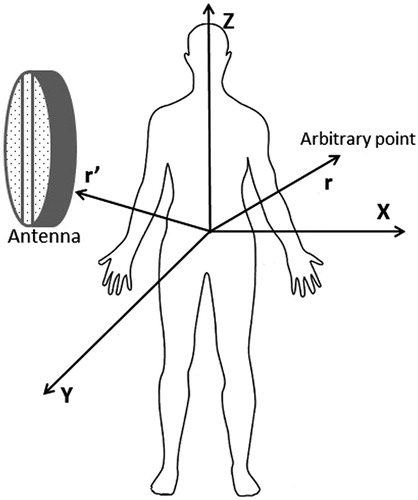
Figure 2. Grid of dielectric properties εr, σ.
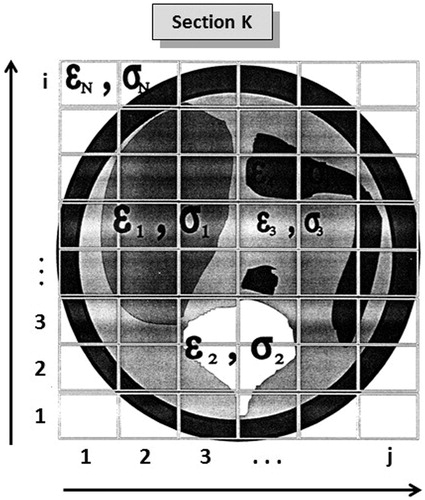
Figure 3. Cubic pulses.
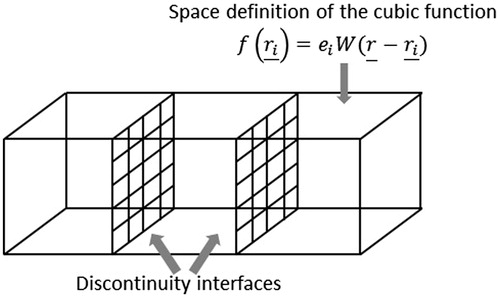
Figure 4. Tuner and applicator layout.
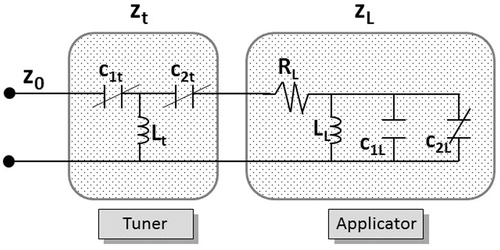
Figure 5. Spectral frequency distribution of reflection coefficient (ρ) and standing waves ratio (S).
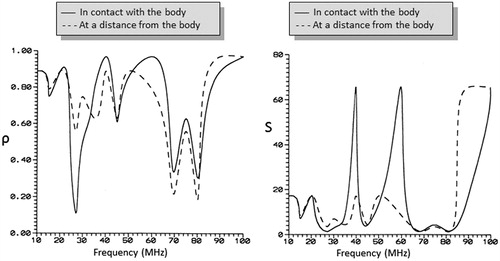
Figure 6. Internal detail of the E-field probe.
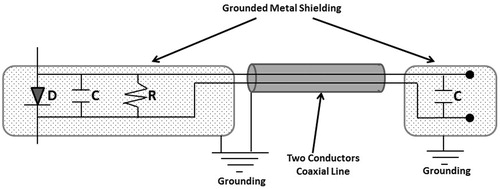
Figure 7. The geometry of the experimental procedure.
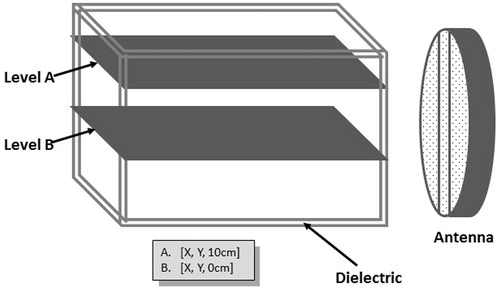
Figure 8. SAR distributions for antenna-dielectric media distance d = 0 cm (case I).
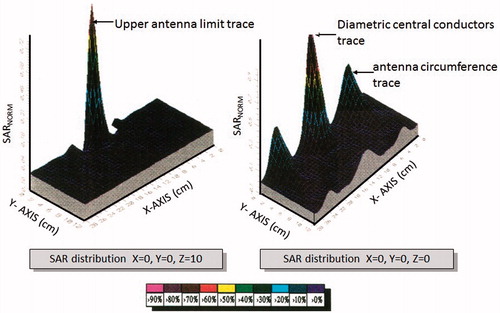
Figure 9. SAR distributions for antenna-dielectric media distance d = 3 cm (case II).
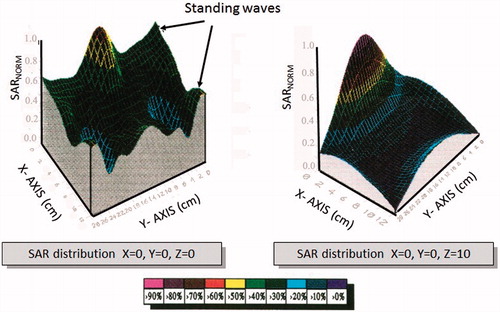
Figure 10. SAR distributions for antenna-dielectric media distance d = 9 cm (case III).
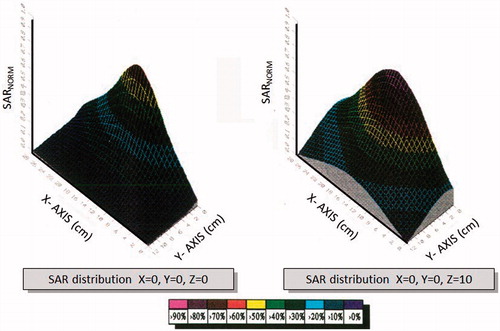
Figure 11. Experimental set-up for temperature measurements.
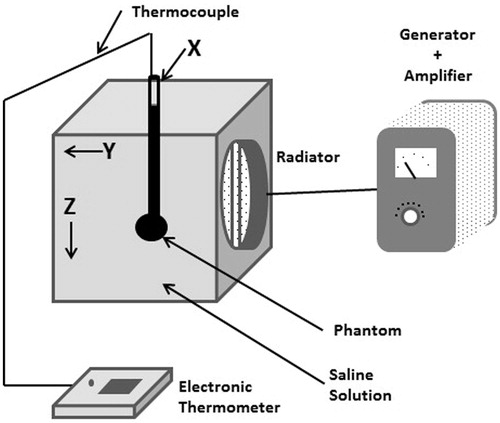
Figure 12. Three transverse plane cuts of temperature measurements.
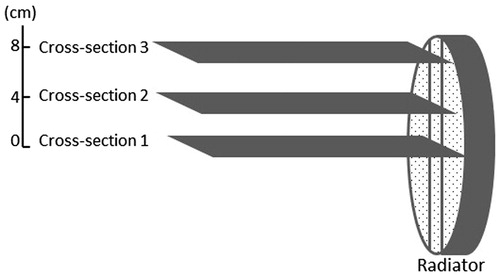
Figure 13. SAR distribution for cross-section 1.
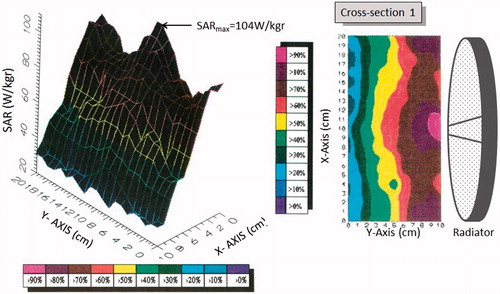
Figure 14. SAR distribution for cross-section 2.
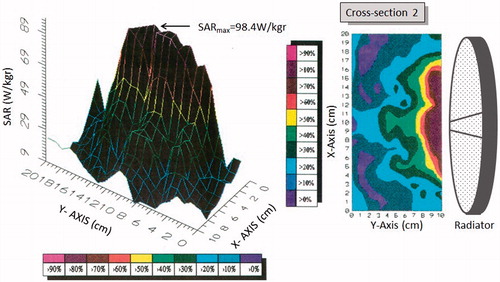
Figure 15. SAR distribution for cross-section 3.
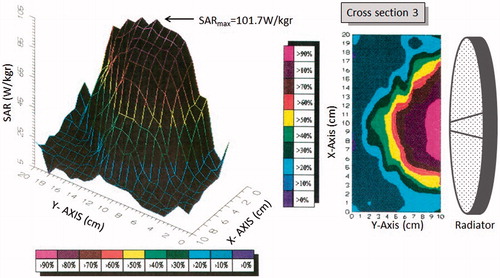
Figure 16. The experimental set-up with the Plexiglas containers filled with soft tissue phantom with the applicator in contact with the containers. The IR image was taken at the central plane.
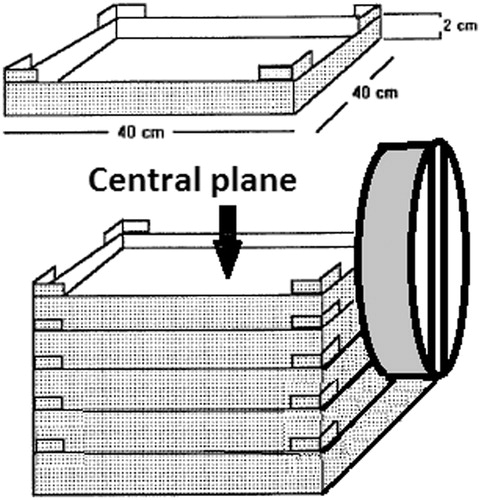
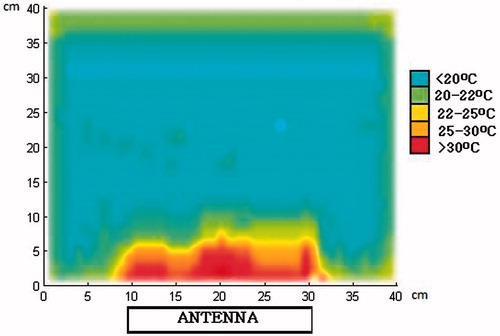
Figure 17. IR temperature profile at the central plane of the Plexiglas containers.