Figures & data
Figure 1. Experimental set-up.
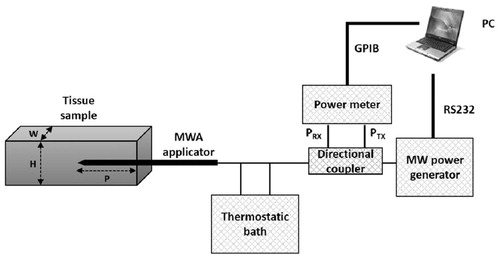
Figure 2. Simulated geometry.
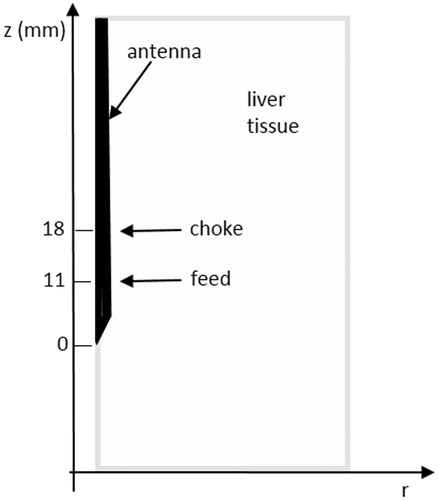
Table 1. Dielectric and thermal properties of liver and fat tissue at 37 °C.
Figure 3. Section along the transversal plane (orthogonal to the antenna’s axis) of an ablated sample of tissue. Cylindrical symmetry is apparent.
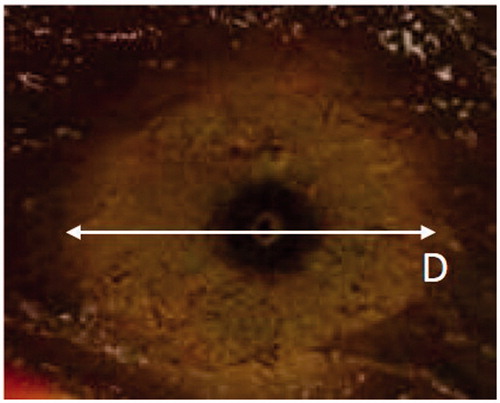
Table 2. Thermal lesion dimensions from ENEA (E) and HS (H) experiments carried out in unrestricted, thin and double-thin liver samples.
Figure 4. Range of variation (minimum–maximum values) of the length of the ablated zone obtained in unrestricted, thin, double-thin tissue samples in two laboratories. The p values of the t-test are also reported (95% CI).
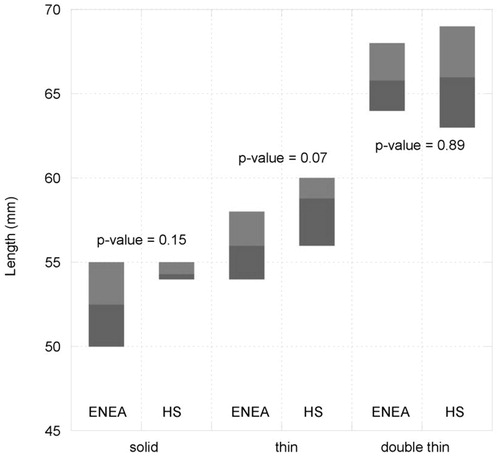
Figure 5. Thermal lesion obtained in a double-thin tissue sample (H<D; W<D).
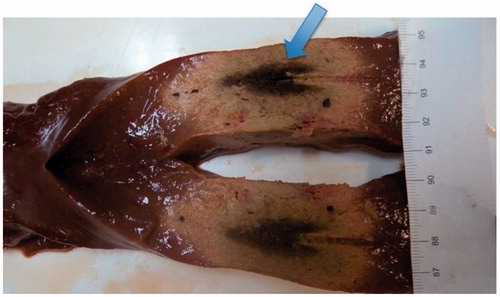
Figure 6. Bi-dimensional distribution in cylindrical coordinates of the SAR computed in unrestricted (A) and double-thin (B) samples. The white dotted line in (B) shows the boundary between liver and air; the arrows highlight the standing wave pattern of the absorbed power, pointing to its local maximum (white arrow) and minimum (grey arrow) values.
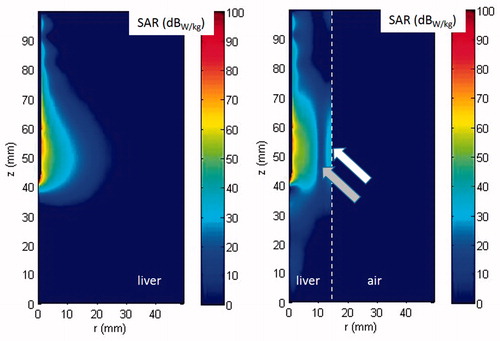
Figure 7. Bi-dimensional distribution of the temperature increase obtained radiating 60 W for 10 min in unrestricted (A) and double-thin samples (B). The white dotted line in (B) shows the boundary between liver and air.
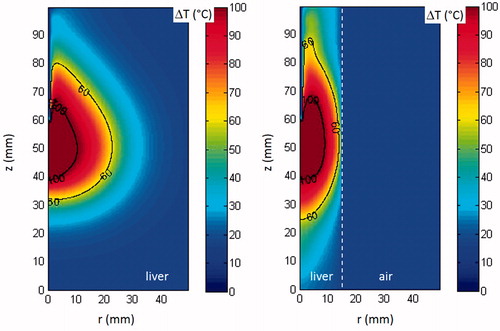
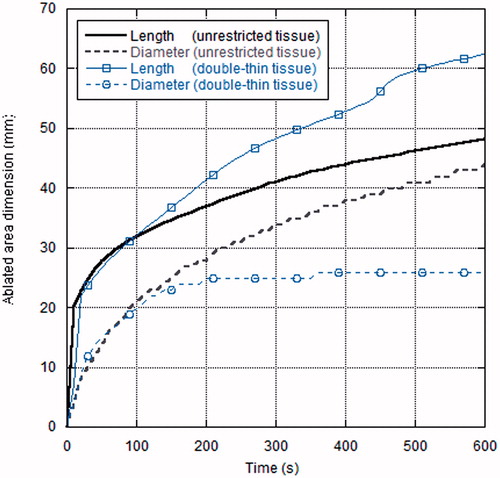
Figure 8. Computed dimensions of the thermal lesion as a function of time. Radiated power: 60 W.