Figures & data
Figure 1. (A) Schematic of the study design for therapy of either PC3 or LAPC-4 tumours in mice. (B) Photograph of experimental equipment used to perform mNPH treatments in mouse tumours. (C) Schematic of the computational model of healthy tissue and tumour with (1) uniform nanoparticle distribution, and (2) concentrated nanoparticle distribution.
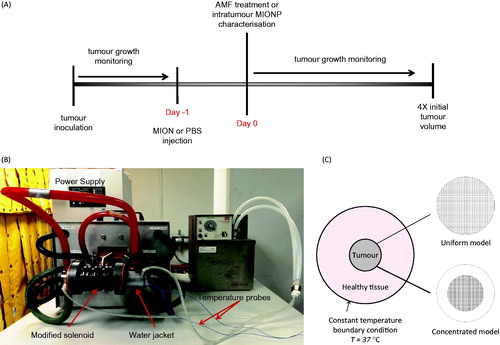
Table 1. Intratumour iron content measured with inductively coupled plasma mass spectrometry (ICP-MS).
Table 2. Thermophysical properties of tumour and healthy tissue.
Figure 2. (A) In vitro measure of surviving fraction of PC3 and LAPC-4 cells exposed to ionising radiation determined from clonogenic survival assays relative to untreated controls. Each data point represents an average of triplicate measurements. Error bars (standard error) do not appear on the log scale. (B) Surviving fraction of PC3 and LAPC-4 cells were exposed to the indicated (water bath) temperature for 60 min ± a 5-Gy dose of ionising radiation determined from clonogenic survival assays relative to untreated controls. Histogram data represent an average of triplicate measurements. Error bars represent standard error (95% CL).
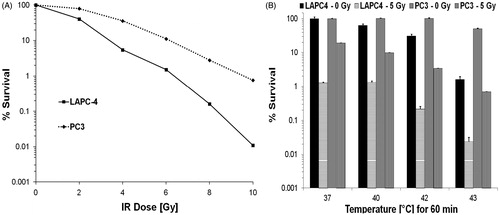
Figure 3. Representative tumour sections harvested from mice stained with Perl’s reagent (Prussian blue) highlighting iron oxide (magnetic iron oxide) distribution.
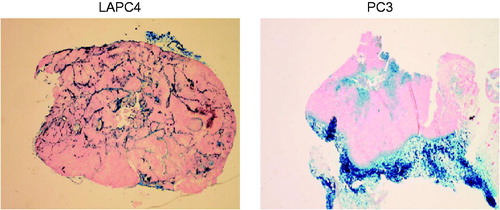
Figure 4. (A) An example of temporal temperature rise during a constant power mNPH. (B) Histogram plot showing LAPC-4 and PC3 tumour response to constant power mNPH therapy. Bars represent mean time to progress to 4 × initial volume (at time of treatment). Tumour growth delay comparison of untreated control, and constant power mNPH, was performed using t-test with unequal variance. Two of the eight mice in the PC3-24 kA/m group showed complete response (no tumour) at 60 days. For comparison purposes 60 days was considered as the time to 4 × for those two mice. (C) Kaplan-Meier plot showing the outcome of varied combinations of mNPH (constant power) for both PC3 and LAPC-4 tumours.
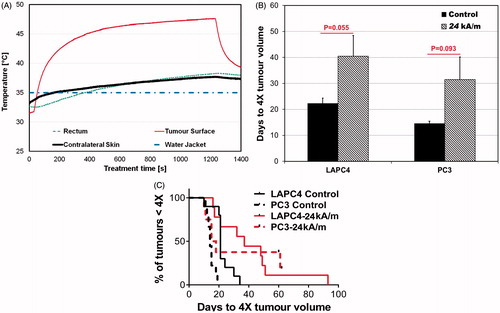
Table 3. Single-point intratumour thermometry of mNPH in PC3 tumours and estimated thermal dose.
Table 4. Single-point tumour surface thermometry of mNPH in LAPC-4 tumours and estimated thermal dose.
Figure 5. (A) Representative four-point thermometry of mice treated with power-modulated mNPH. Single-point temperatures were measured at one-second intervals with optical fiber temperature probes placed into the tumour (Tumour), in a similar location subcutaneously on the opposite thigh (Contralateral) to tumour, inserted in the rectum (Rectal), and affixed to the surface of the water jacket (Water Jacket). (B) Kaplan–Meier plot summarizing outcome of power-modulated mNPH ± RT (5 Gy), and RT (RT5 and RT8) in LAPC-4 tumours. (C) As in B, but for PC3 tumours. (D) Histogram plot showing LAPC-4 tumour response to therapy as in B. Bars represent mean time to progress to 4X initial volume (compared to time of treatment, t0). A tumour growth delay comparison between groups was performed using t-test with unequal variance. (E) As in D for PC3 tumours. Key for symbols used in figures: ns p > 0.05; *p ≤ 0.05; **p ≤ 0.01; ***p ≤ 0.001; ****p ≤ 0.0001.
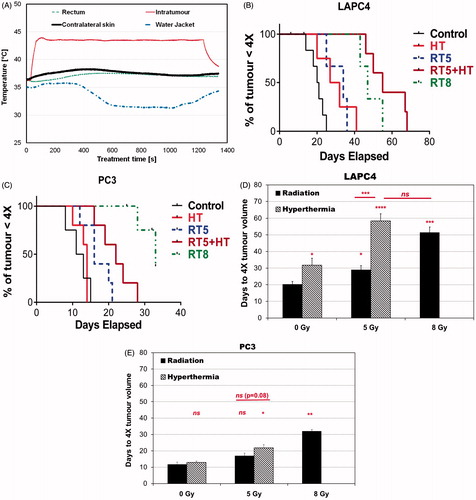
Figure 6. (A) Temperature distribution of uniform distribution model after 60 min of heating at constant power of QP = 4.6 × 10⁵ W/m3. (B) As in A for concentrated distribution model. (C) Variation of tumour–tissue boundary temperature with time for uniform and concentrated distribution models under heating at constant power of QP = 4.6 × 10⁵ W/m3.
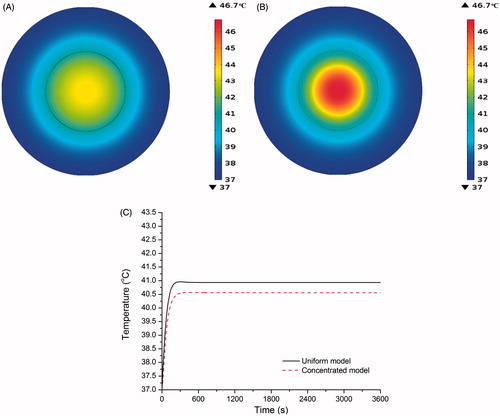
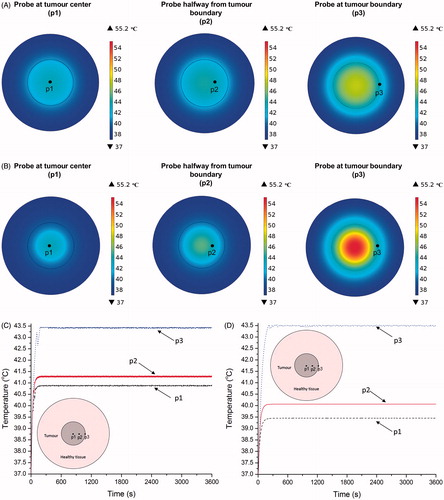
Figure 7. (A) Temperature distribution of uniform distribution model after 60 min of heating at modulated power based on temperature feedback from (1) probe at tumour centre, (2) probe at halfway between tumour centre and tumour–tissue boundary, (3) probe at tumour–tissue boundary. (B) Same as A for concentrated model. (C) Variation of tumour–tissue boundary temperature with time for uniform distribution model under heating at modulated power based on temperature feedback from (1) at the tumour centre (Probe 1), (2) at the midpoint between tumour centre and tumour–tissue boundary (Probe 2); and, (3) at the tumour–tissue boundary (Probe 3). (D) Same as C for concentrated model.