
Figures & data
Figure 1. (A) Highly asymmetric non-linear pressure waveform with shock fronts at the focus typical for histotripsy. Different pulsing schemes used in (B) cavitation cloud histotripsy and (C) boiling histotripsy approaches. (D) Cavitation cloud histotripsy lesion in ex vivo porcine myocardial muscle. (E) H&E section at the boundary of the lesion showing the bisection of myocytes and the complete homogenisation of tissue (after Parsons et al. [Citation12]). (F) Boiling histotripsy lesion in ex vivo bovine liver tissue. (G) H&E section through the lesion boundary showing complete disintegration of cells in the lesion.
![Figure 1. (A) Highly asymmetric non-linear pressure waveform with shock fronts at the focus typical for histotripsy. Different pulsing schemes used in (B) cavitation cloud histotripsy and (C) boiling histotripsy approaches. (D) Cavitation cloud histotripsy lesion in ex vivo porcine myocardial muscle. (E) H&E section at the boundary of the lesion showing the bisection of myocytes and the complete homogenisation of tissue (after Parsons et al. [Citation12]). (F) Boiling histotripsy lesion in ex vivo bovine liver tissue. (G) H&E section through the lesion boundary showing complete disintegration of cells in the lesion.](/cms/asset/e849aec9-e85b-4075-89fb-87ec01b20457/ihyt_a_1007538_f0001_c.jpg)
Figure 2. (A) Histotripsy was applied to the prostate transcutaneously in anaesthetized canine subjects. A transrectal ultrasound imaging probe provided real-time visualisation of the prostate and cavitation bubble cloud during treatment. (B) H&E stained cross-section of the prostate four weeks after treatment. The targeted volume (devoid of debris) is seen within the glandular prostate communicating with the urethra.
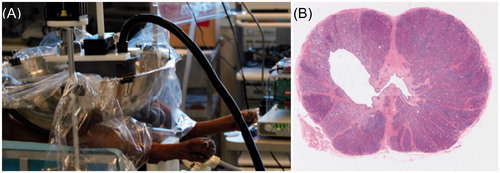
Figure 3. (A) H&E slide showing intact vessels (indicated by arrows) remained in the completely fractionated liver. (B) There is no statistical significance in the number of vessels above 300-µm diameter in the treated and control regions. (This figure is adapted from Vlaisavljevich et al. [Citation56]).
![Figure 3. (A) H&E slide showing intact vessels (indicated by arrows) remained in the completely fractionated liver. (B) There is no statistical significance in the number of vessels above 300-µm diameter in the treated and control regions. (This figure is adapted from Vlaisavljevich et al. [Citation56]).](/cms/asset/7f689657-22c1-4f5c-80a0-757182edf25d/ihyt_a_1007538_f0003_c.jpg)
Figure 4. Ultrasound images of the femoral vein captured by a linear array imaging probe between treatments of a thrombus. (A, B) The original appearance of the vessel on 2D imaging and with colour Doppler. (C, D) The thrombus after 240 s of treatment (one scan). (E, F) The final condition of the clot after 720 s (three scans). Note the decreased echogenicity in the lumen on C and E compared with A. Also, a flow channel is clearly visible on D and F, while none was present before treatment in B. (This figure is adapted from Maxwell et al. [Citation72]).
![Figure 4. Ultrasound images of the femoral vein captured by a linear array imaging probe between treatments of a thrombus. (A, B) The original appearance of the vessel on 2D imaging and with colour Doppler. (C, D) The thrombus after 240 s of treatment (one scan). (E, F) The final condition of the clot after 720 s (three scans). Note the decreased echogenicity in the lumen on C and E compared with A. Also, a flow channel is clearly visible on D and F, while none was present before treatment in B. (This figure is adapted from Maxwell et al. [Citation72]).](/cms/asset/73aca3e3-5291-44c4-9533-3e9bc9bd5df7/ihyt_a_1007538_f0004_c.jpg)
Figure 5. (A) Fragment size distributions from abbreviated lithotripter and histotripsy treatments. (B) Histotripsy erosion rates for various pulse rates and pressures showing saturation effect. (C) Measured comminution rates for SWL, histotripsy, and combined therapy.
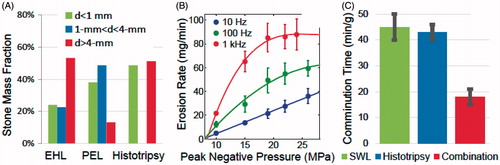
Figure 6. (A) A boiling histotripsy transducer built to treat through large overlying tissue paths such as liver. (B) Three mechanical lesions generated at shallow depth in ex vivo bovine liver tissue, showing the tadpole shape. (C) Lesions generated through different liver thicknesses showing consistent dimensions. Ultrasound was generated from the top of the frames. (D) In situ pressure waveform determined using non-linear de-rating method from characterisation measurements in water [Citation18,Citation92].
![Figure 6. (A) A boiling histotripsy transducer built to treat through large overlying tissue paths such as liver. (B) Three mechanical lesions generated at shallow depth in ex vivo bovine liver tissue, showing the tadpole shape. (C) Lesions generated through different liver thicknesses showing consistent dimensions. Ultrasound was generated from the top of the frames. (D) In situ pressure waveform determined using non-linear de-rating method from characterisation measurements in water [Citation18,Citation92].](/cms/asset/7ae33d69-c061-4657-924e-49bca4db7418/ihyt_a_1007538_f0006_c.jpg)
Figure 7. (A) Experimental set-up for generating boiling histotripsy lesions in ex vivo porcine kidney. (B) Mechanical lesion in a cortex of the kidney treated with boiling histotripsy. (C) Histological appearance of a section of boiling histotripsy lesion demonstrating homogenisation of the targeted region.
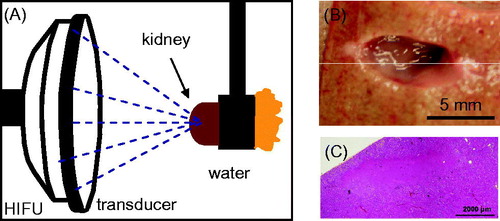
Figure 8. (A) Diagram of the experimental set-up for boiling histotripsy of subcutaneous B16 melanoma tumours in mice. (B) Frames of B-mode ultrasound recorded before and during boiling histotripsy treatment of the tumour. (C) The dynamics of the tumour growth before and after boiling histotripsy or sham treatment (n = 4 per group). Although the treatment delayed the tumour growth, it did not affect the subsequent tumour growth rate.
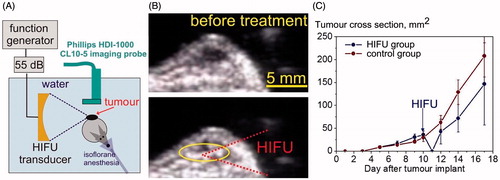
Figure 9. (A) Photos of boiling histotripsy lesions in ex vivo bovine liver in cross-section after rinsing (left). Rinsed lesions reveal remaining vasculature and connective tissue that were preserved after sonication. Histomicrographs of representative sections stained with NADH-d (centre) and picrosirius red (right). Unstained regions in the NADH-d stained sections indicate thermal damage. Orange-red birefringence in the picrosirius red stain sections indicate fibrillar collagen (yellow arrows). Large calibre vessels can be observed to be intact. Dashed yellow line indicates the border of the lesions. Scale bar represents 5 mm. (B) Masson’s trichome stained sections showing small calibre patent vessels (yellow arrows). Scale bar represents 100 μm. (C) Cross section of volumetric lesion with lysed cell debris washed out and with the remaining connective tissue manipulated. Scale bar represents 5 mm.
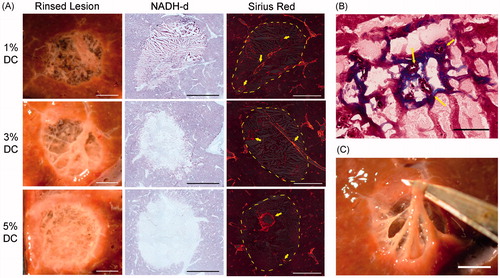
Figure 10. Microtripsy resulting from a single principal negative half-cycle exceeding the intrinsic threshold for cloud cavitation histotripsy. (A) A representative acoustic waveform for a 500-kHz histotripsy pulse measured in water with a fibre-optic probe hydrophone (FOPH). (B) Cavitational bubble cloud and (C) corresponding lesion generated in a red blood cell (RBC) phantom using 500-kHz histotripsy pulses with an estimated peak negative pressure of 26.2 MPa (estimated using linear summation). (D) Demonstration of fine spatial resolution as evidenced in the phrase reading ‘M’ (vertical scale bar 1 mm). (Produced using a 3-MHz transducer, and this figure is adapted from Lin et al. [Citation14]).
![Figure 10. Microtripsy resulting from a single principal negative half-cycle exceeding the intrinsic threshold for cloud cavitation histotripsy. (A) A representative acoustic waveform for a 500-kHz histotripsy pulse measured in water with a fibre-optic probe hydrophone (FOPH). (B) Cavitational bubble cloud and (C) corresponding lesion generated in a red blood cell (RBC) phantom using 500-kHz histotripsy pulses with an estimated peak negative pressure of 26.2 MPa (estimated using linear summation). (D) Demonstration of fine spatial resolution as evidenced in the phrase reading ‘M’ (vertical scale bar 1 mm). (Produced using a 3-MHz transducer, and this figure is adapted from Lin et al. [Citation14]).](/cms/asset/c31a60bb-55ea-467f-868e-2e6b5a5a589b/ihyt_a_1007538_f0010_c.jpg)