Figures & data
Figure 1. Block diagram of a single generator, multi-output MW thermo-ablative system.
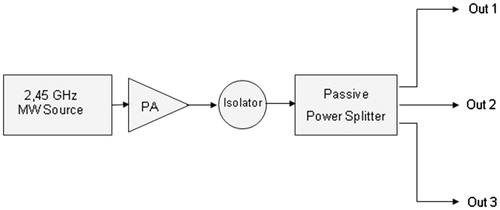
Figure 2. Numerical analysis domain (dimensions 120 × 60 × 60 mm). EM and TH boundary conditions are applied on all faces of the domain.
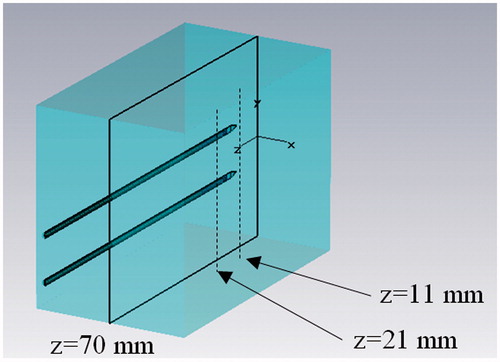
Table 1. Physical properties of muscle tissue at 2.45 GHz frequency and 37°C temperature.
Figure 3. Preliminary simulations comparing high energy pulsed (10 kJ, 1 s) (a), 6 min transient (b) and steady-state (c) power density distributions in the xy plane (z = 21 mm) for a dual applicator array operating at 2.45 GHz frequency.
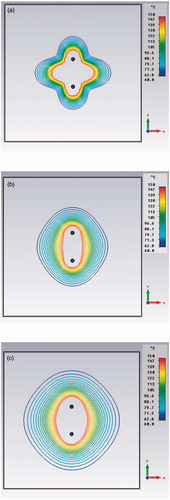
Figure 4. Power density distribution in the xy plane (x = 0, z = 21 mm) using a pair of applicators at D = 12 mm, Pref = 1 W: in-hase feeding (green line), out-of-phase feeding (blue line), asynchronous feeding (red line).
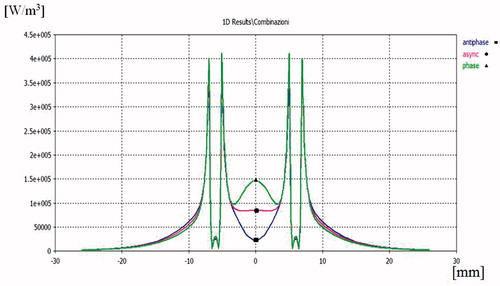
Figure 5. Temperature distribution in the xy plane (x = 0, z = 21 mm) (a), in the yz plane (y = 0, z = 21 mm) (b) and in the xz plane (x = 0, y = 0) (c), produced by a pair of applicators at D = 12 mm and with Ptot = 40 W: in-phase feeding (green line), out-of-phase feeding (blue line), asynchronous feeding (red line). In (a), the black dashed line refers to a single applicator with the same input power.
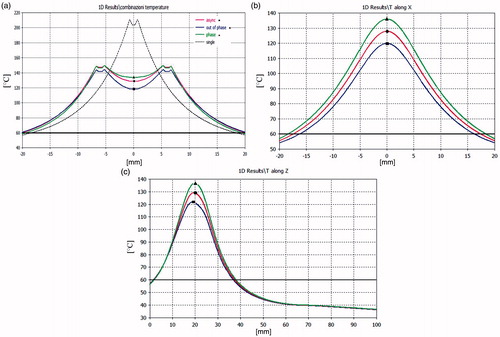
Figure 6. Power density distribution in the xy plane (x = 0, z = 21 mm) using a pair of applicators at D = 20 mm, Ptot = 20 W: in-phase feeding (green line), out-of-phase feeding (blue line), asynchronous feeding (red line).
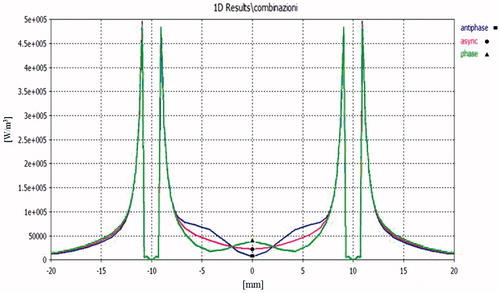
Figure 7. Power density distribution in the xy plane (z = 21 mm) of a dual applicator array operating in FSS mode during the first semi-period (a), and during the second semi-period (b).
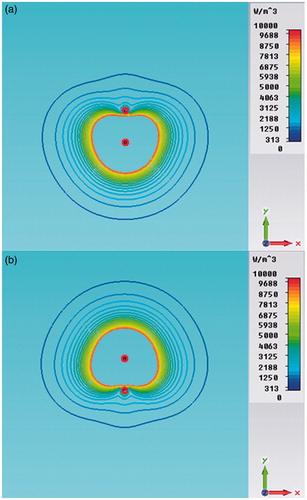
Figure 8. Power density distributions in the xy plane (z = 21 mm) of a dual applicator array operating in FSS mode (a) and in synchronous mode (b).
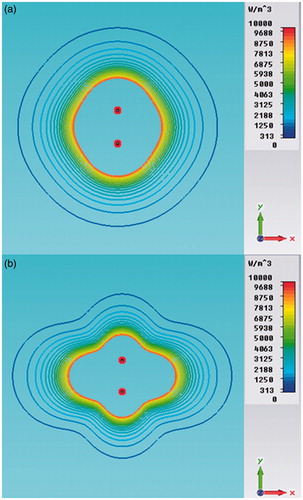
Figure 9. Temperature distribution in the xy plane (z = 21 mm) of a dual applicator array operating in FSS mode (a) and in synchronous mode (b).
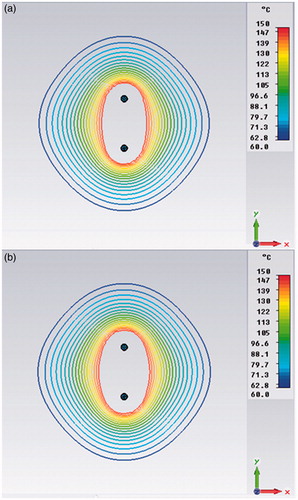
Figure 10. Block diagram of the asynchronous switched-mode TATO system.
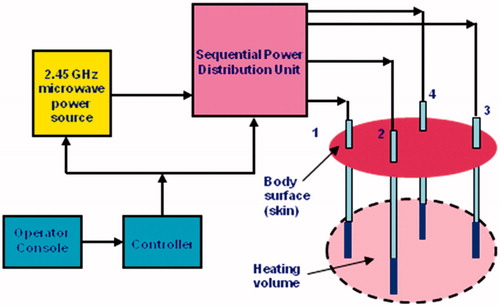
Figure 11. The test bed used for the synchronous versus FSS (asynchronous) feeding comparison. Block diagram (a) and laboratory arrangement (b).
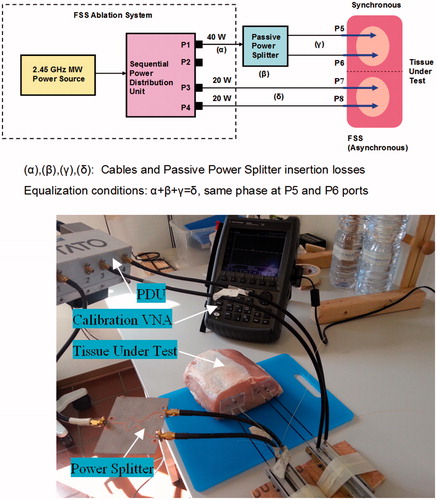
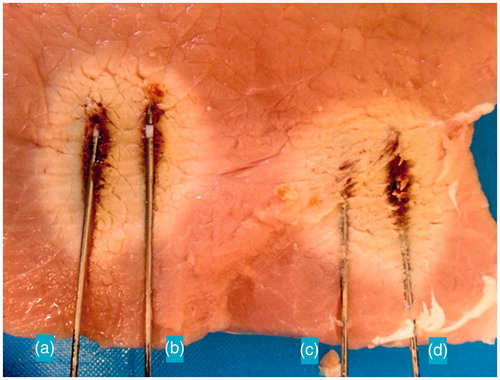
Figure 12. Comparison of TH ablation between synchronous and FSS (asynchronous) feeding modalities: (a) longitudinal cut, (b) transverse cut.
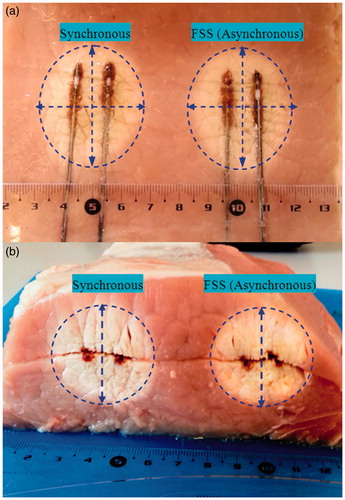
Figure 13. Distortions in temperature behaviours due to the applicator A and B input mismatching.