Figures & data
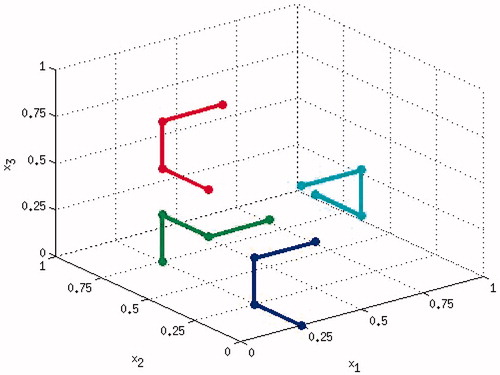
Figure 1. A graphical representation of the sampling strategy in the Morris method for three parameters. Four random starting points are selected and then trajectories are formed from these so that three main effects can be computed for each starting location.
![Figure 2. Axisymmetric geometry adapted from Trujillo et al. [Citation4,Citation5].](/cms/asset/c35c0369-ecea-44da-b4b0-36b4170705ca/ihyt_a_1032370_f0002_c.jpg)
Table 1. Values of the specific heat capacity of liver ± standard deviation with references.
Table 2. Values for the density of liver with references.
Table 3. Baseline values of thermal conductivity k0 in W/m/K.
Table 4. Rate of change of thermal conductivity Δ k in W/m/K2.
Table 5. Electrical conductivity σ in S/m of liver tissue.
Table 6. Rate of change of the electrical conductivity in %/K.
Table 7. Blood perfusion (ω) values for the liver converted to consistent units of s-1.
Table 8. Water content C of liver tissue.
Table 9. Summary of parameter value ranges used in the sensitivity study given as a range. These are contrasted against the IT’IS database [Citation16].
Table 10. Final set of parameters included in the sensitivity analysis.
Figure 3. Results of the Morris method when considering the ablation zone size at the end of the procedure. The means of the main effects are plotted along the x axis and the standard deviations along the y axis. The solid line is plotted for y = ± x and for points below the line the mean is larger than the standard deviation and therefore the expected value of the mean is non-zero.
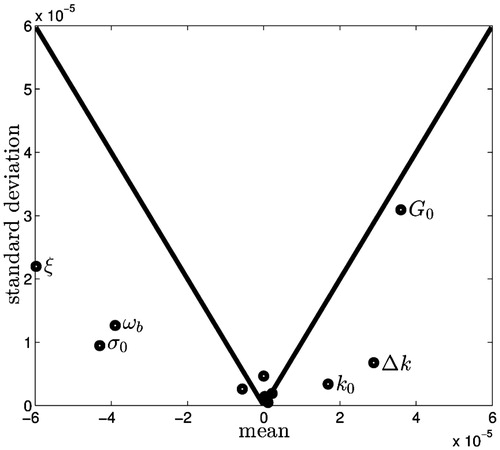
Figure 4. Sensitivity measures plotted versus time and contrasted against the mean ablation zone area. The long-term behaviour is of interest here and it can be seen that σ0, ωb, ξ and G0 have the greatest impact on the ablation zone area due to their relatively large mean. The standard deviations are also larger for some of these parameters, indicating parameter interactions or non-linear responses. A, B, and C denote initial, steady-state, and transient periods respectively.
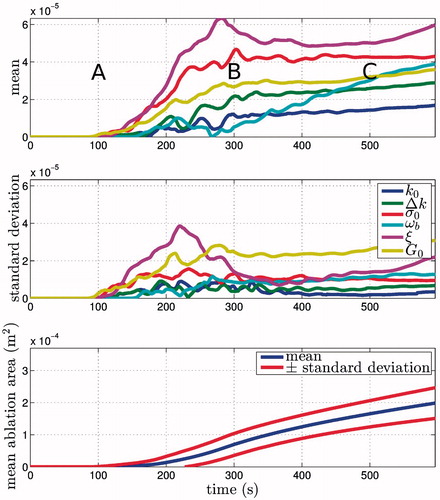
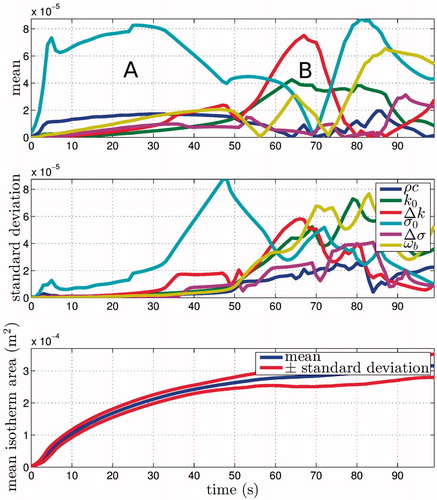
Figure 5. Sensitivity measures for the 50 °C isotherm versus time contrasted against the mean area. The changes in the area of the isotherm are complex but are separated into regions of (A) active heating and (B) cooling. During the initial heating phase σ0 and dominates. During cooling the thermal parameters perfusion ωb, baseline thermal conductivity k0 and rate of change of thermal conductivity Δk are the most important.