Figures & data
Figure 1. Morphological analysis of exosomes by EM. Exosomes from MCF-7 cells without doxorubicin treatment, or doxorubicin-treated MCF-7 cells with or without heat-stress treatment were purified by serial centrifugation and sucrose gradient ultra-centrifugation. The morphology of exosomes was visualised under EM. Bars = 100 nm. Data were representative images of individual exosome samples from three independent experiments.
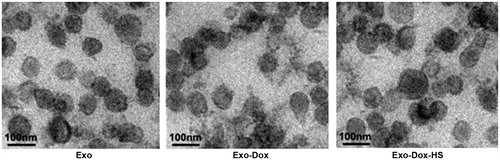
Figure 2. Western blot analysis of exosomes. The relative levels of Hsp70, CD63 and TSG 101 to the control β-actin in the Exo, Exo-Dox and Exo-Dox-HS exosome samples were determined by Western blot assays and quantified by densitometric scanning. (A) Western blot analysis. (B) Quantitative analysis. Data are representative images and expressed as the mean ± SD of the relative values from three independent experiments. **p < 0.01.
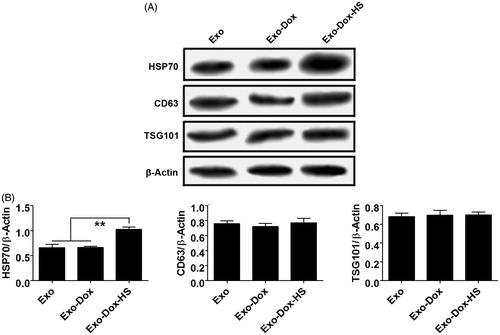
Figure 3. Quantification of doxorubicin in exosomes. The contents of doxorubicin in the same amount of Exo, Exo-Dox, and Exo-Dox-HS exosomes were determined by flow cytometry and quantified for the fluorescent intensity. (A) Representative histograms. (B) The fluorescence intensity of doxorubicin in the different groups of exosomes. Data are representative histograms and expressed as the mean ± SD of the fluorescent intensity of each group of exosome samples from three separate experiments. **p < 0.01; NS, not significant.
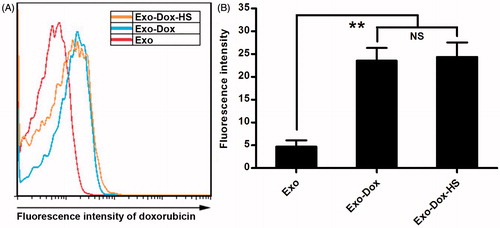
Figure 4. The quantity of exosomes produced by the heat-stress-treated MCF-7 cells. MCF-7 cells (1 × 10⁷/flask) were treated with PBS or doxorubicin and some cells from each group were treated with heat stress. The exosomes produced were purified simultaneously and the total amounts of proteins in each group of exosomes were determined by BCA assay. Data are expressed as the mean ± SD of each group from three independent experiments. **p < 0.01.
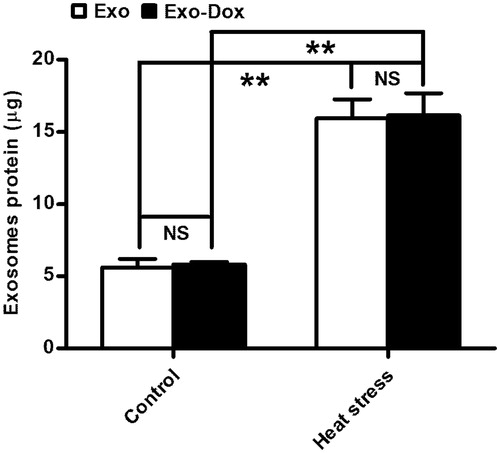
Figure 5. Effects of doxorubicin-containing exosomes on tumour cell proliferation in vitro. (A) A standard curve of doxorubicin fluorescent intensity. (B) Quantity of doxorubicin in exosomes from 1 × 10⁷ doxorubicin-treated MCF-7 tumour cells with or without heat-stress treatment. (C) Exosomes from the doxorubicin-treated MCF-7 cells inhibit the proliferation of MCF-7 cells. MCF-7 cells were treated with Exo-Dox-HS, Exo-Dox, Exo (from 1 × 10⁷ or 2 × 10⁷ MCF-7 cells), or 10 μg doxorubicin for the indicated time periods. The cells in medium alone served as negative controls. The proliferation of different groups of MCF-7 cells was measured by MTT assay. Data are expressed as the mean ± SD of individual groups of cells from three separate experiments. ***p < 0.001.
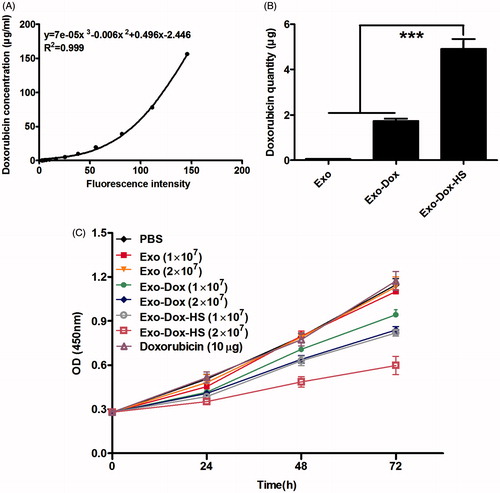
Table 1. Statistical analysis of each group to inhibit MCF-7 proliferation.
Figure 6. Doxorubicin-containing exosomes induce MCF-7 cell apoptosis. MCF-7 cells were treated with Exo-Dox-HS, Exo-Dox or Exo from the same number of MCF-7 cells for 24 h, and stained with FITC-Annexin V and propidium iodide. The frequency of apoptotic cells was analysed by flow cytometry. Some cells from each group were subjected to TEM examination or Western blot analysis of the relative levels of cleaved caspase-3 and -8. Data are representative images, flow cytometry charts, and expressed as the mean ± SD of each group of cells from three separate experiments. (A) Flow cytometry analysis of apoptotic cells. (B) Quantitative analysis of apoptotic cells. (C) TEM analysis of apoptotic cells. (D) Western blot analysis. *p < 0.05, **p < 0.01.
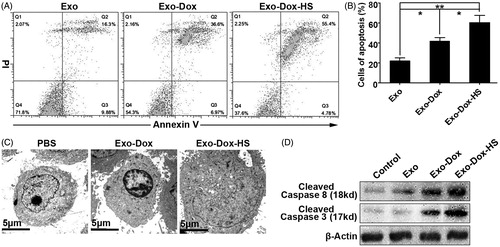
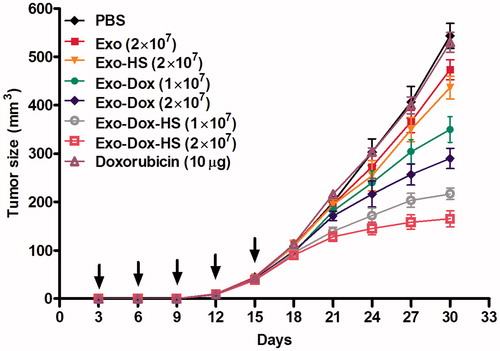
Figure 7. Doxorubicin-containing exosomes inhibit the growth of MFC-7 cells in vivo. Individual BALB/c nude mice were inoculated subcutaneously with 1 × 10⁷ MCF-7 cells and three days after inoculation, the mice were injected subcutaneously with Exo-Dox-HS, Exo-Dox (from 1 × 10⁷ or 2 × 10⁷ cells), Exo, Exo-HS (from 2 × 10⁷ cells), 10 μg doxorubicin or PBS (100 µL) every 3 days for five times. The growth of implanted breast tumours was monitored. Data are expressed as mean ± SD of tumour volumes from each group (n = 5) from two separate experiments. Arrows indicate the time points for treatment.