Figures & data
Figure 1. Schematic of the experimental set-up.
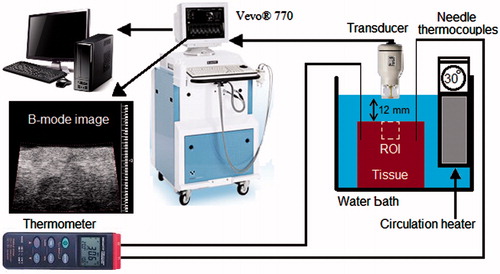
Figure 2. The averaged (100 RF lines) values of (A) and (B) p1, (C) and (D) p2, (E) and (F) p3 in tissue-mimicking gel phantom (left column) and ex vivo bovine muscle tissue (right column) at temperatures of 26°, 34°, 38° and 46 °C.
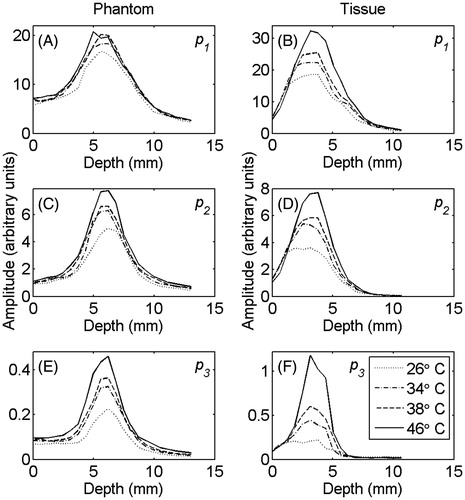
Figure 3. Changes in (A) p1, (B) p2, (C) p3 and the ratios (D) p2/p1 and (E) p3/p1 as a function of temperature in tissue-mimicking gel phantoms with respect to the initial temperature (26 °C). The error bars represent the standard deviation of five trials.
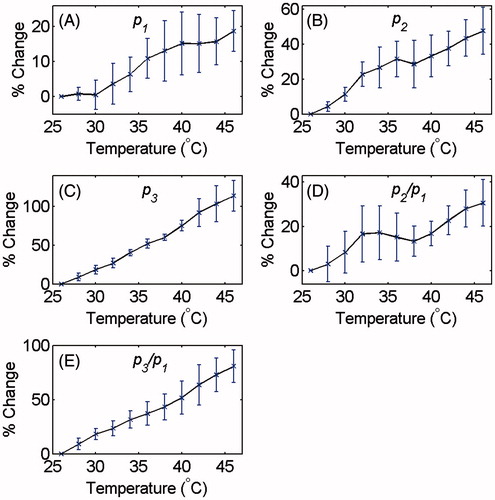
Figure 4. Changes in (A) p1, (B) p2, (C) p3 and the ratios (D) p2/p1 and (e) p3/p1 as a function of temperature in ex vivo bovine muscle tissues with respect to the initial temperature (26 °C). The error bars represent the standard deviation of six trials.
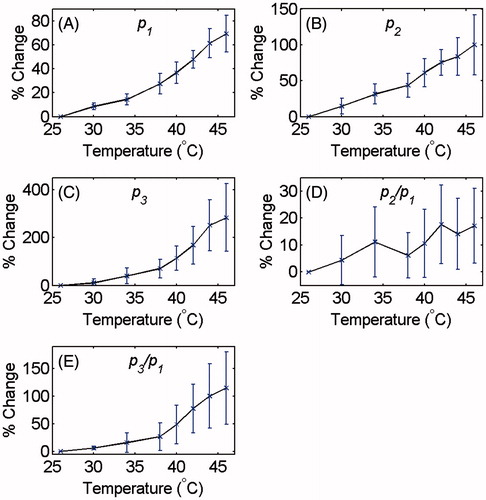
Table 1. Percentage increase in p1, p2, p3 and the ratios p2/p1 and p3/p1 as the temperature was increased from 26° to 46 °C in tissue-mimicking gel phantoms and ex vivo tissue samples.
Figure 5. Changes in (A) E, (B) E1, (C) E2, (D) E3 and the ratios (E) E2/E1 and (F) E3/E1 at the focal region as a function of temperature in tissue-mimicking gel phantoms with respect to the initial temperature (26 °C). The error bars represent the standard deviation of five trials.
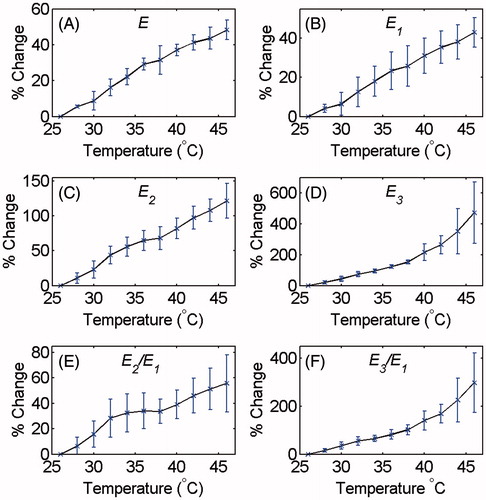
Figure 6. Changes in (A) E, (B) E1, (C) E2, (D) E3 and the ratios (E) E2/E1 and (f) E3/E1 at the focal region as a function of temperature in ex vivo bovine muscle tissues with respect to the initial temperature (26 °C). The error bars represent the standard deviation of six trials.
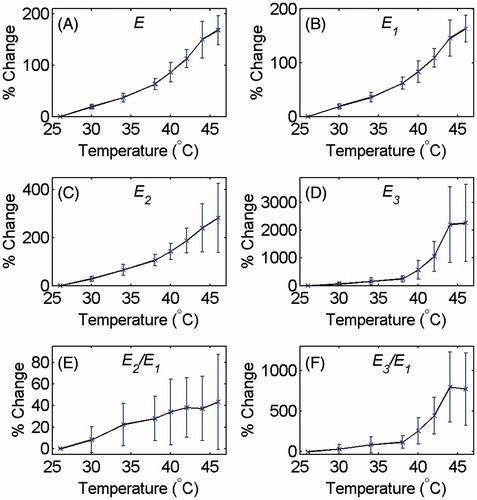
Table 2. Percentage increase in E, E1, E2, E3 and the ratios E2/E1 and E3/E1 as the temperature was increased from 26° to 46 °C in tissue-mimicking gel phantoms and ex vivo tissue samples.
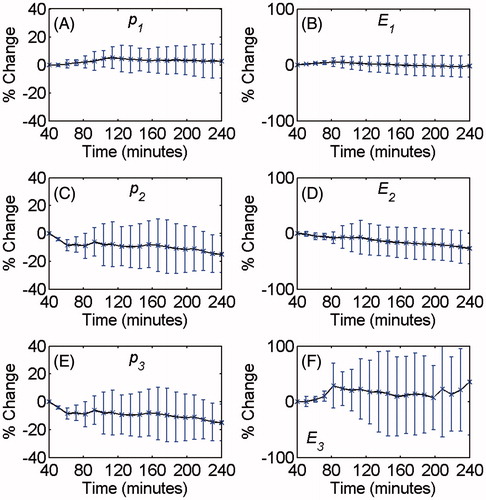
Figure 7. Changes in (A) p1, (B) E1, (C) p2, (D) E2, (E) p3 and (F) E3 at 44 °C as a function of time in ex vivo bovine muscle tissues with respect to the initial time (40 min). The error bars represent the standard deviation of four trials.