Figures & data
Figure 1. Experimental set-up for injecting ferrofluid into bilateral tumours using a syringe pump. The mouse is placed on an electric heating pad during the injection process.
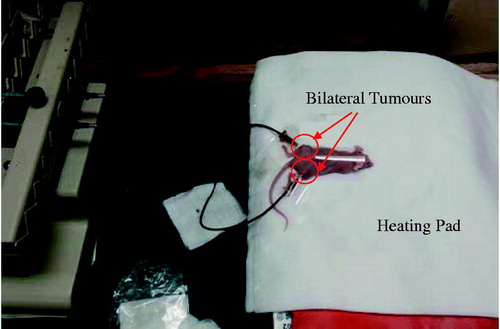
Figure 2. Schematic diagram of the heating experiment with 0.1 cm3 of ferrofluid in an insulated container inside a two-turn water-cooled coil.
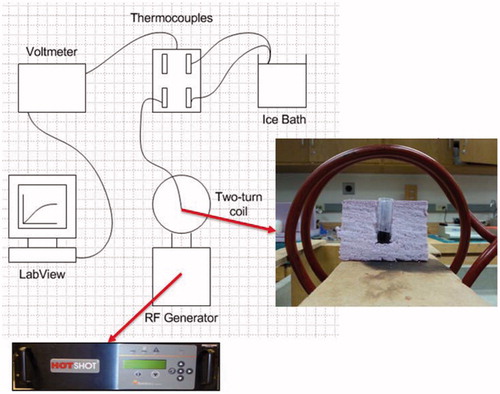
Figure 3. Processes of generating a tumour model from a micro-CT image (a), to a MATLAB generated tumour boundary (b), to an ImageJ tumour geometry (c), and to a smoothed tumour model by Rhinoceros (d).
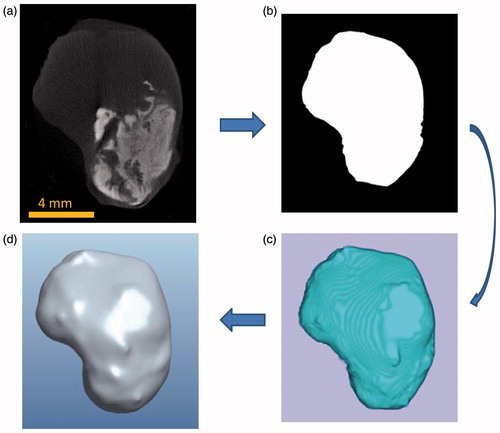
Figure 4. (a) A typical micro-CT image before applying the threshold, and (b) a micro-CT image showing only voxels containing nanoparticles to determine the nanoparticle distribution volume.
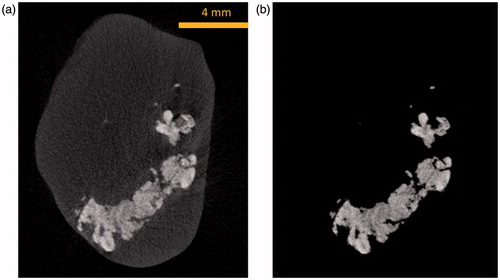
Figure 5. Pro/Engineer models and corresponding maximum intensity projection (MIP) images of a scanned tumour in the (a) axial plane, (b) sagittal plane, and (c) coronal plane.
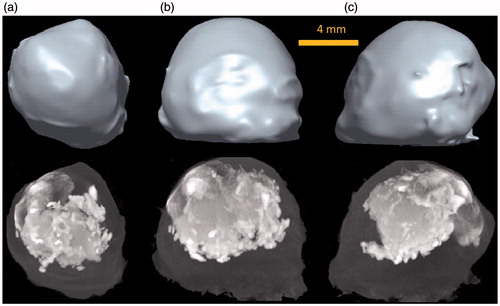
Figure 6. MIP images of tumours injected at an infusion rate of (a) 3 μL/min, (b) 4 μL/min, and (c) 5 μL/min in the axial (I), sagittal (II), and coronal (III) planes.
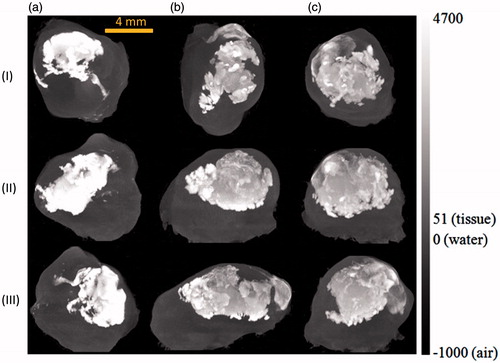
Figure 7. Dependence of the nanoparticle distribution volume and its standard deviation on the infusion rate. The symbol * represents p < 0.05 and ** represents p < 0.001.
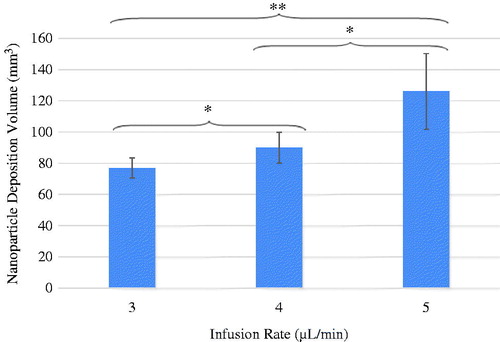
Figure 8. Linear approximation of the relationship between the micro-CT HU and greyscale values, based on micro-CT scans of air, water, and ferrofluid samples at various concentrations (n = 5).
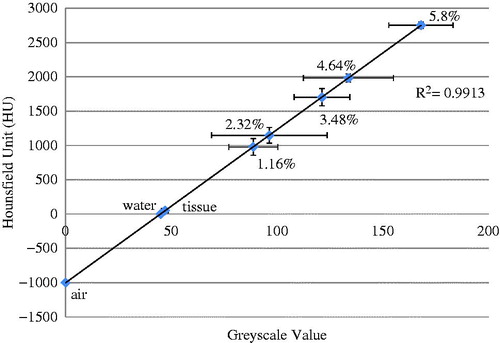
Figure 9. Effect of the ferrofluid concentration on the volumetric heat generation rate (qMNH). Symbols and error bars represent experimental measurements, while the straight line gives the curve fitted relationship between the qMNH and the ferrofluid concentration. The sample size of each group is three.
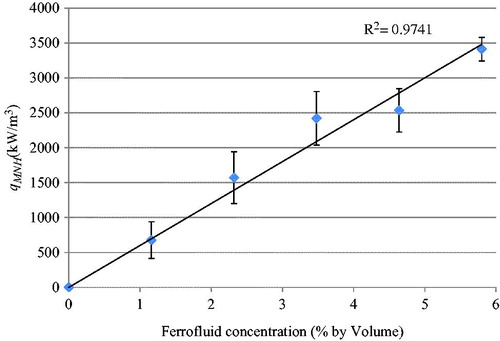
Table 1. Comparison of the obtained SLP range with that in previous studies.
Figure 10. An obtained linear relationship between the qMNH and micro-CT HU values.
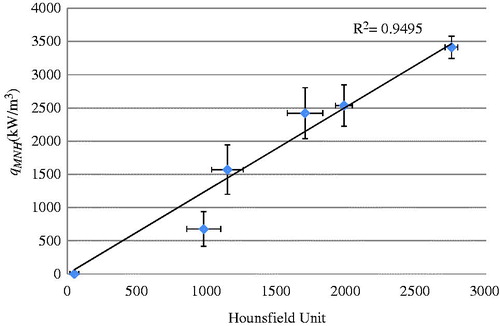
Figure 11. (a) Nanoparticle distribution from micro-CT imaging system and (b) the corresponding qMNH distribution in COMSOL in the axial (I), sagittal (II), and coronal (III) plane, respectively.
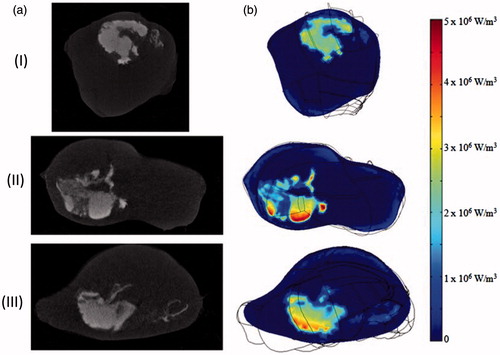
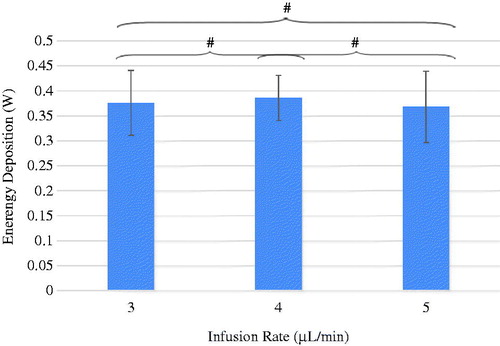
Figure 12. The effect of the infusion rate on the total energy deposition rate in the tumours. #p > 0.9.