Figures & data
Figure 1. Schema and concepts of an endoluminal ultrasound applicator positioned in the GI tract for thermal therapy of pancreatic tumours. The applicator is illustrated as positioned in the duodenum for sonication of tumours in the head of the pancreas, following placement and insertion strategies common in endoscopy. Transducer arrays are configured for focused or diffuse patterns to provide a high degree of spatial control and volumetric heating.
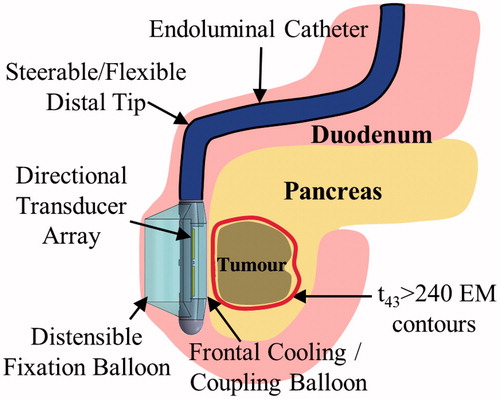
Figure 2. Considered transducer (yellow) configurations: (a) planar, (b) tubular section, (c) lightly focused curvilinear along the azimuthal direction, and (d) strongly focused curvilinear along the elevation direction, with respect to the (e) transducer coordinate system. The planar and curvilinear transducers are 20 × 10 mm along the elevation and azimuthal directions, and the tubular section is an 80° sector with a 6-mm radius of curvature and a 20-mm length.
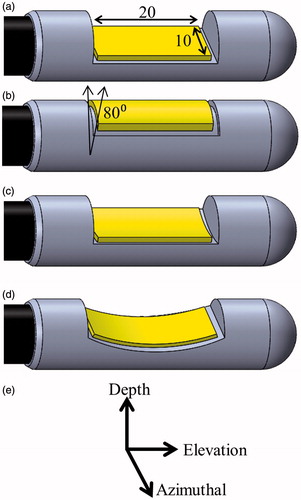
Table 1. Material properties used in acoustic and biothermal modelling.
Figure 3. 3D generalised pancreatic tumour model employed for parametric studies of endoluminal ultrasound thermal therapy.
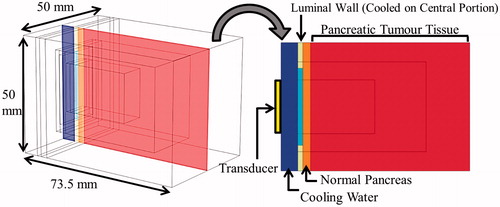
Table 2. General anatomical characteristics of patient anatomy models of pancreatic tumours.
Figure 4. Cross-sectional temperature distributions and 240 EM43 °C contours (black dashes) for ablation studies in the generalised tumour model for 10 × 20 mm planar, lightly focused, strongly focused, and 80° tubular transducer configurations operating at 2 MHz, after 5 min of active sonication.
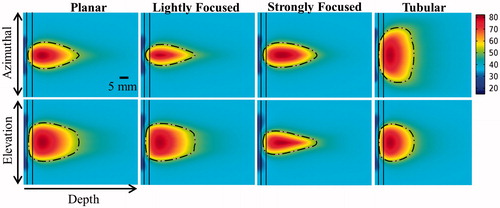
Figure 5. Effects of transducer configuration and operating frequency on (a) tumour ablation volume (thermal dose > 240 EM43 °C), (b) penetration depth (measured from inner luminal wall) of thermal lesion, (c) maximum temperature, and (d) maximum thermal dose of luminal wall tissue, after a single 5-min sonication with a temperature set point of 80 °C and 3 min of post-sonication cooling.
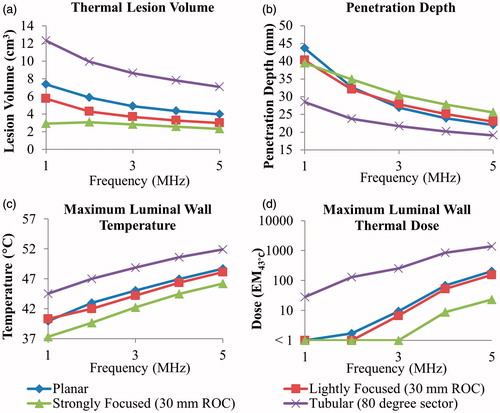
Figure 6. Effects of radius of curvature for 2 MHz curvilinear transducers on (a) tumour ablation volume (dose > 240 EM43 °C), (b) penetration depth (measured from inner luminal wall) of thermal lesion, and (c) maximum temperature of luminal wall tissue, after a single 5-min sonication with a temperature set point of 80 °C and 3-min post-sonication cooling.
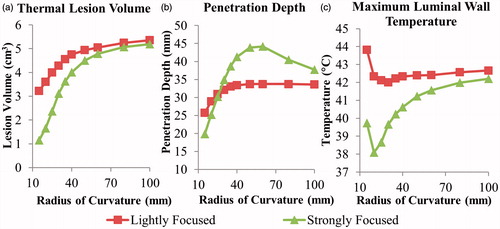
Figure 7. Effects of pancreatic tissue attenuation coefficient on (a, d) tumour ablation volume (dose > 240 EM43 °C), (b, e) penetration depth (measured from inner luminal wall) of thermal lesion, and (c, f) maximum temperature of luminal wall tissue, after a single 5-min sonication at 2 MHz operating frequency, with a maximum temperature set point of 80 °C and 3-min post-sonication cooling period. The tumour attenuation coefficient is 1.25× the corresponding pancreatic tissue attenuation in (a–c), and equivalent to the pancreatic tissue attenuation in (d–f).
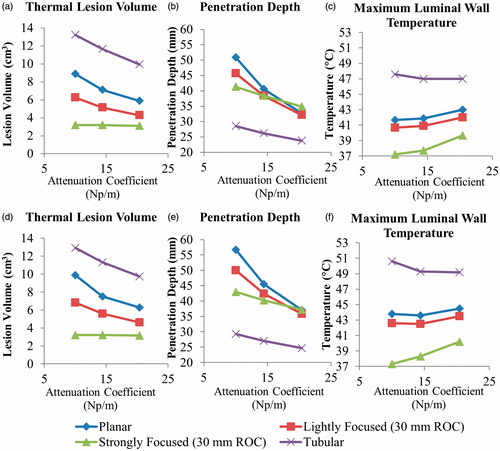
Figure 8. Effects of transducer configuration and operating frequency on (a) tumour volume elevated above 40 and 43 °C, and penetration depth (measured from inner luminal wall) of 40 and 43 °C temperature contours, at steady-state with a maximum temperature set point of 45 °C for generation of moderate hyperthermia.
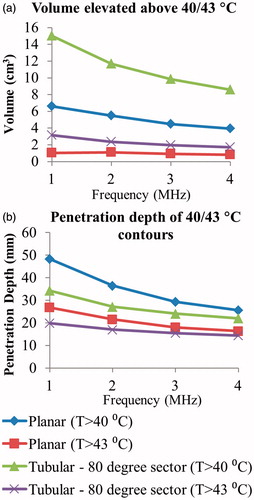
Figure 9. (a) 3D model of the Example 1 anatomy, consisting of a small pancreatic head tumour directly adjacent to the duodenal lumen and positioned applicator. (b) 240 EM43 °C contours for ablation simulations using a 2 MHz planar (dashed contour) and 2 MHz lightly focused curvilinear transducer with a 25 mm ROC (dotted contour) across the central transverse slice through the applicator. (c) Temperature distributions and 40 and 43 °C contours (grey with dashes) are given for a hyperthermia simulation using a 1 MHz tubular section transducer. A: applicator, T: tumour, P: pancreas, DW: duodenal wall, PD: pancreatic duct.
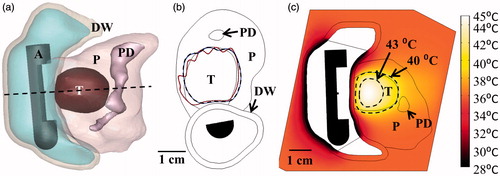
Table 3. Parameters and outcomes for patient anatomy ablation simulations.
Table 4. Parameters and outcomes for patient anatomy hyperthermia simulations.
Figure 10. (a) Ablated lesion volume (dose > 240 EM43 °C) overlaid with the Example 2 model anatomy, consisting of a small head tumour surrounded by the SMA, PD, and BD, using a 2 MHz strongly focused curvilinear transducer. (b) Maximum temperatures and 240 EM43 °C contours across a sagittal plane for two ablation simulations: without (top) and with (bottom) simulated cooling of the bile duct, all other treatment parameters being identical. Sparing of the bile duct (BD) could be achieved by perfusing it with cooling water for the duration of the ablation treatment. (c) Temperature distributions and 40 and 43 °C contours (grey with dashes) for hyperthermia produced by rotating a 1.5 MHz planar applicator. A: applicator, T: tumour, P: pancreas, DW: duodenal wall, PD: pancreatic duct, BD: bile duct, SMA: superior mesenteric artery.
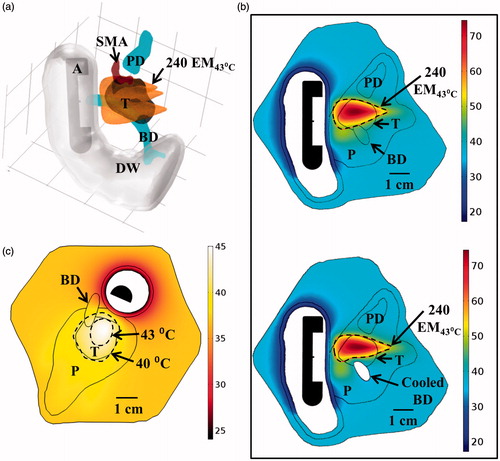
Figure 11. (a) 3D model of the Example 3 large pancreatic head tumour and surrounding anatomy, illustrating proximity of tumour to significant vasculature. (b) Ablated lesions were produced in the tumour by translating an applicator with a 2 MHz planar transducer to three individual positions along the length of the duodenum, with the cumulative thermal lesion shown at the bottom. (c) Temperature distribution and 40 and 43 °C contours (grey with dashes) across an axial plane for hyperthermia simulation using a 1.5 MHz planar transducer rotated at a single position in the duodenum. A: applicator, T: tumour, P: pancreas, D: duodenum, PD: pancreatic duct, PV: portal vein, SMV: superior mesenteric vein, SMA: superior mesenteric artery.
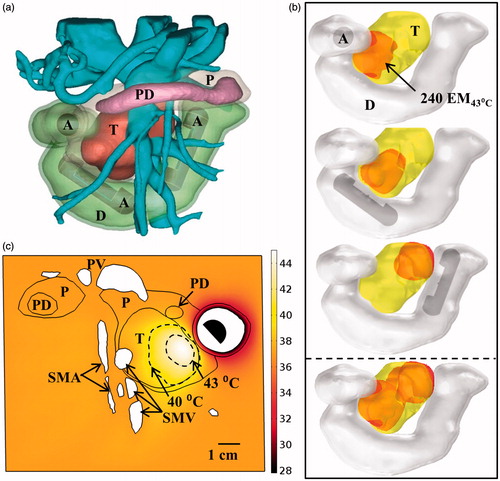
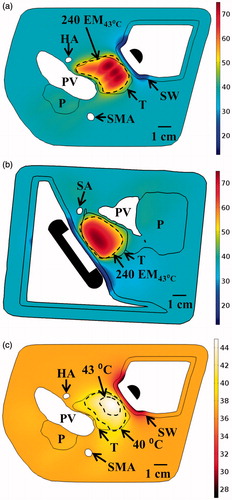
Figure 12. Maximum temperature distributions and 240 EM43 °C contours (dashed) across (a) axial and (b) sagittal planes after ablation treatment for the Example 4 body tumour model, as treated with an applicator positioned in the stomach lumen with a 30 × 10 mm 2 MHz planar transducer. (c) Temperature distribution and 40 and 43 °C contours (grey) across an axial slice for hyperthermia by rotating a 1.5 MHz planar applicator. T: tumour, SW: stomach wall, P: pancreas, PV: portal vein, SMA: superior mesenteric artery, HA: hepatic artery, SA: splenic artery.