Figures & data
Table 1. Tumor-biological relevance of pre-selected miRNA types.
Table 2. Molecular classification of investigated breast cancer cell lines [Citation40].
Table 3. Pre-selected miRNA specimen based on comprehensive survey (PubMed (http://www.ncbi.nlm.nih.gov/), miRTarBase platform (http://mirtarbase.mbc.nctu.edu.tw/) [Citation1]) and expression analysis in experimental setting. BC = verified functional impact in breast cancer; source: Chou et al. [Citation87].
Figure 1. Box plot diagram of expression levels of secreted miR-10b in breast cancer cell lines under varying treatment conditions. Levels of secreted miR-10b expression were determined in MCF-7, BT-474, SK-BR-3 and MDA-MB-231 cells under control conditions, extracellular acidosis, hypoxia or hyperthermia. Box plots demonstrate median (thick black line), lower and upper quantile range (box lines), and standard deviation range (dashed lines bounded by horizontal lines). *Significant expression level alterations (p ≤ 0.05) of control conditions versus treatment options. Based on triplicate experiments, real-time quantitative PCR.
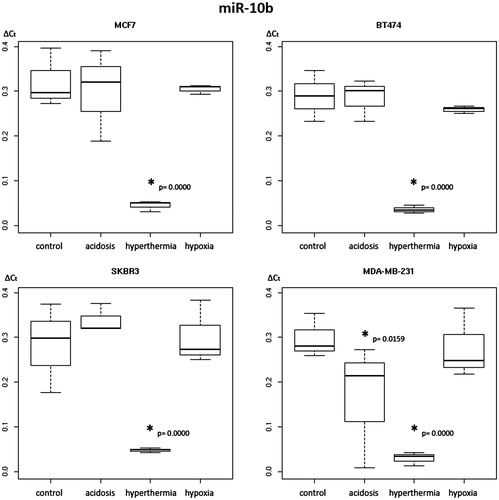
Figure 2. Box plot diagram of expression levels of secreted miR-15b in breast cancer cell lines under varying treatment conditions. Levels of secreted miR-15b expression were determined in MCF-7, BT-474, SK-BR-3 and MDA-MB-231 cells under control conditions, extracellular acidosis, hypoxia or hyperthermia. Box plots demonstrate median (thick black line), lower and upper quantile range (box lines), and standard deviation range (dashed lines bounded by horizontal lines). *Significant expression level alterations (p ≤ 0.05) of control conditions versus treatment options. Based on triplicate experiments, real-time quantitative PCR.
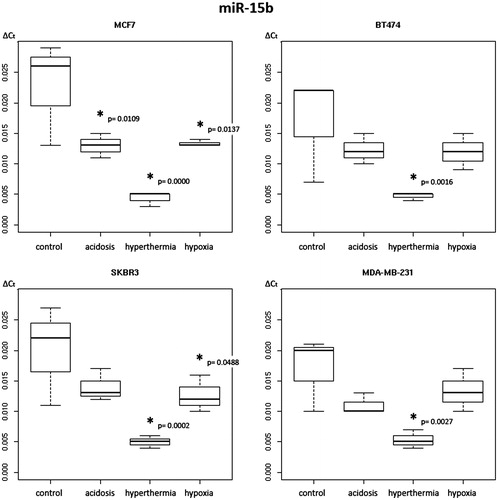
Table 4. Two-way analysis of variance for levels of secreted miR-10b under control, hyperthermic, acidotic and hypoxic conditions in four different breast cancer cell lines
Table 5. Two-way analysis of variance for levels of secreted miR-15b under control, hyperthermal, acidotic and hypoxic conditions in four different breast cancer cell lines.
Figure 3. Box plot diagram of expression levels of secreted miR-139 in breast cancer cell lines under varying treatment conditions. Levels of secreted miR-139 expression were determined in MCF-7, BT-474, SK-BR-3 and MDA-MB-231 cells under control conditions, extracellular acidosis, hypoxia or hyperthermia. Box plots demonstrate median (thick black line), lower and upper quantile range (box lines), and standard deviation range (dashed lines bounded by horizontal lines). *Significant expression level alterations (p ≤ 0.05) of control conditions versus treatment options. Based on triplicate experiments, real-time quantitative PCR.
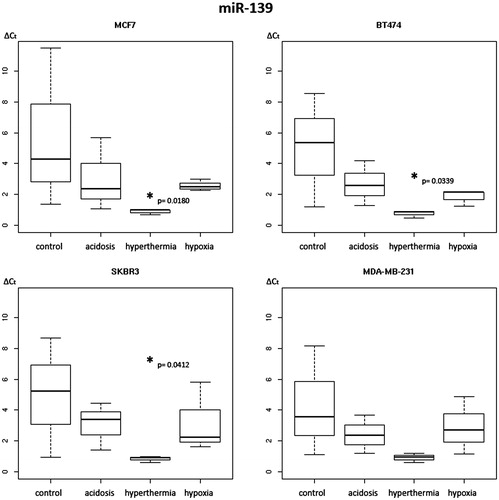
Table 6. Two-way analysis of variance for levels of secreted miR-139 under control, hyperthermic, acidotic and hypoxic conditions in four different breast cancer cell lines
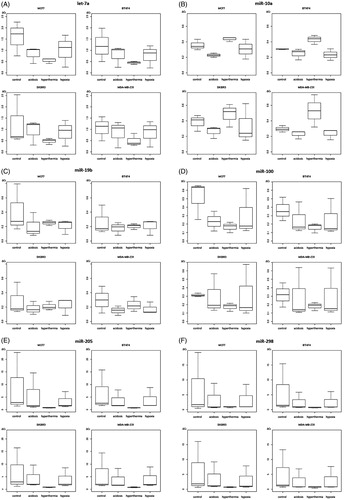
Figure 4. Box plot diagrams of expression levels of secreted miRNAs let-7a (A), miR-10a (B), miR-19b (C), miR-100 (D), miR-205 (E) and miR-298 (F) in breast cancer cell lines under varying treatment conditions. Levels of secreted miRNA expression were determined in MCF-7, BT-474, SK-BR-3 and MDA-MB-231 cells under control conditions, extracellular acidosis, hypoxia or hyperthermia. Box plots demonstrate median (thick black line), lower and upper quantile range (box lines), and standard deviation range (dashed lines bounded by horizontal lines). No significant expression level alterations were detected in these miRNA types. Based on triplicate experiments, real-time quantitative PCR.