Figures & data
Figure 1. Flowchart: inclusion of families in the present study.
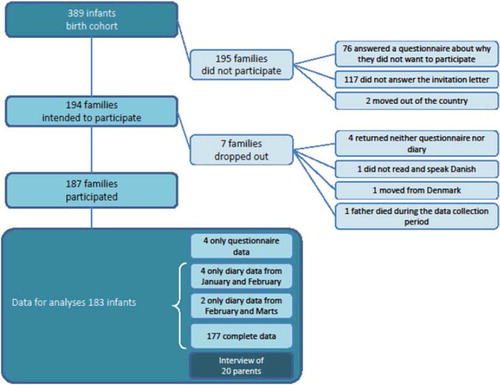
Figure 2. The probability of parent-rated illness () or doctor contact () given that the parents ticked off the corresponding event – one of the selected symptoms (greyscale lines) or parent-rated illness (dashed line) – on the diary card the same day or 1, 2, or 3 days before. The probability on the day of the event indicates the relative importance of the symptom (highest importance shaded darkest); the slope of the corresponding line indicates its acuteness.
Note: Reading example: In it can be seen that when the infant's breathing is affected, there is a 49.2% probability that the parents rate the infant as ill, i.e. the level of the corresponding line at 0 days after the event was ticked off (at the left-hand side). Furthermore, the probability that the parents rate the infant as ill two days later – the two-day predictive value of the symptom – is 35.0%, i.e. the level of the corresponding line at two days after the event was ticked off (in the right-hand part of the graph). Hence, the slope of the graph indicates how the symptom affects the future. The difference between the two probabilities is caused mostly by infants in whom the symptom has disappeared during the two days, so that the parents do not rate the infant as ill any more. Then, if the infant's breathing is affected and the parents rate the infant as ill, an estimate for the probability that they still rate the infant as ill two days later is simply calculated as 35.0/49.2 × 100% = 71.1%. Thus, the line's slope relative to its level can be viewed as indicative of how the symptom influences the illness duration. In , the probability of contacting the doctor when the infant has trouble breathing is 19.2%, and 10.2% two days later – read as the level of the corresponding line at 0 and 2 days after the event was ticked off, respectively, in the graph. Hence, the slope of the line here is indicative of the speed with which the parents contact a doctor.
Table I. Baseline characteristics of the cohort of 183 children, assessed at 11 months of age at the start of the diary data collection period. Listed are (for interval-scale data) medians with inter-quartile range (IQR) and full range of the data, or (for categorical data) numbers in each category with percentages.
Table II. Prevalence of selected events – symptoms, parent-rated illness, and doctor contacts over the 90 days of observation.1,2
Figure 3. The probability of doctor contact given the parent-rated illness severity. The probabilities are shown unadjusted (dashed line) and adjusted for the presence of selected symptoms (greyscale lines). The greater the difference between the unadjusted and the adjusted probabilities, the more important the symptom in the relationship between doctor contact and parent-rated illness severity. Symptoms that cause the greatest adjustment for parent-rated illness severity XXX are shaded darkest.
Note: Reading example: when the parents rate their infant as ill with a severity of XX, the probability of contact with the doctor is 42.9%, i.e. the level of the dashed line for severity XX. The line corresponding to affected breathing has a level of 38.1% at severity XX. Hence, when the infant has trouble breathing and the parents rate the child as ill XX, we can calculate that (42.9–38.1)/42.9 × 100% = 11.2% of doctor contact can be attributed to the presence of the symptom, and 38.1/42.9 × 100% = 88.8% to the illness severity rating.