Figures & data
Figure 1. Flow chart of patients with elevated calcium concentrations at Tibro Health Care Centre, Sweden, 1995–2000, and re-examination of the patients with elevated and normal calcium concentrations during 2009–2010. Notes: §Included in our previous study [Citation3]. ∆Patients with hypercalcaemia at baseline not included in previous study because of technical problems. ‡ Two persons only answered the questionnaire, no laboratory samples.
![Figure 1. Flow chart of patients with elevated calcium concentrations at Tibro Health Care Centre, Sweden, 1995–2000, and re-examination of the patients with elevated and normal calcium concentrations during 2009–2010. Notes: §Included in our previous study [Citation3]. ∆Patients with hypercalcaemia at baseline not included in previous study because of technical problems. ‡ Two persons only answered the questionnaire, no laboratory samples.](/cms/asset/b97e7198-bc47-488b-b441-23053c759460/ipri_a_861152_f0001_b.gif)
Table I. Characteristics of patients with elevated and normal calcium concentrations, 1995–2000 and 2008–2010, men and women, at Tibro Health Care Centre, Sweden.
Table II. Comparison between diagnoses in percentage of patients with elevated calcium concentrations at first examination in 1995–2000 at Tibro Health Care Centre and diagnoses found after second clinical examination and register investigation in 2009–2010.
Figure 2. Mortality of patients with elevated (≥ 2.56 mmol/L) and normal (≤ 2.46 mmol/L) calcium concentrations, Panel A: men, Panel B: women, at Tibro Health Care Centre in 1995–2000. Mortality in both men and women, Panel C: with different calcium concentrations (≥ 2.56, 2.31–2.46, ≤ 2.30 mmol/L). Note: Censored = follow-up period interrupted.
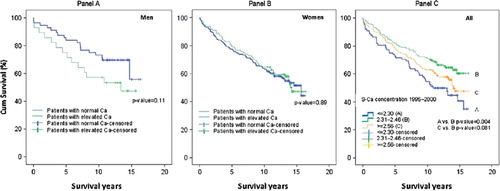
Table III. Time to death in years in patients with different causes of death: Comparison between patients with elevated and normal calcium concentrations.