
Figures & data
Figure 1. Flow chart showing number (%) of participations in the primary outcome measurements in 2006 and 2008.
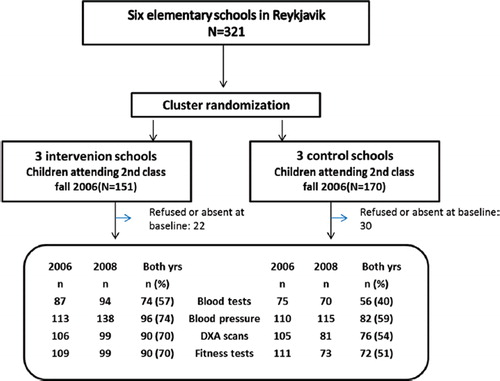
Table I. Descriptive statistics of the study population at start of the study.
Table II. Comparison of various cardiovascular risk factors between intervention group and control group after intervention.
Table III. Regression cluster analysis with SBP at the end of intervention as the dependent factor.
Table IV. Regression cluster analysis with DBP at the end of intervention as the dependent factor.