Figures & data
Figure 1. Flow chart showing the progress of trials through the review (RCT: randomized controlled trials).
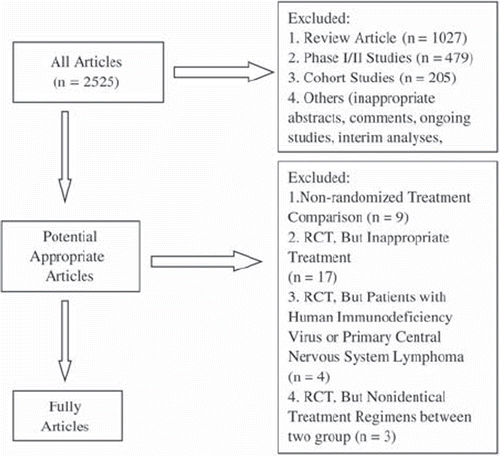
Table I. Summary of trials included in the meta-analysis.*
Figure 2. Meta-analysis of overall survival among patients receiving rituximab with chemotherapy (R-chemo) or chemotherapy alone. n = number of events; N = number of patients; 95% CI = 95% confidence interval; RR = relative risks; The diamond shows the 95% confidence intervals for the pooled relative risks. Values greater than 1.0 indicate relative risks that favor R-chemo.
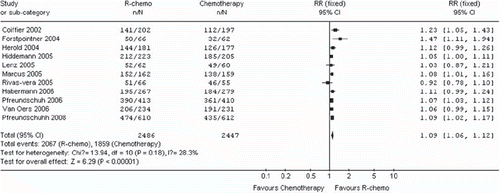
Figure 3. Overall survival for the subgroups of patients with diffuse large B-cell lymphoma, mantle cell lymphoma or follicular lymphoma receiving rituximab with chemotherapy (R-chemo) or chemotherapy alone. n = number of events; N = number of patients; 95% CI = 95% confidence interval; RR = relative risks; The diamond shows the 95% confidence intervals for the pooled relative risks. Values greater than 1.0 indicate relative risks that favor R-chemo.
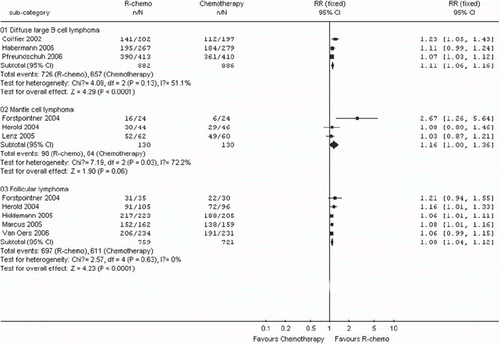
Figure 4. Meta-analysis of overall response rate for patients receiving rituximab with chemotherapy (R-chemo) or chemotherapy alone. n = number of events; N = number of patients; 95% CI = 95% confidence interval; RR ˆrelative risks; The diamond shows the 95% confidence intervals for the pooled relative risks. Values greater than 1.0 indicate relative risks that favor R-chemo.
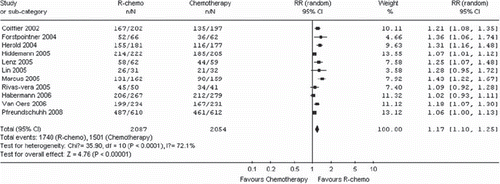
Figure 5. Meta-analysis of complete response for patients receiving rituximab with chemotherapy (R-chemo) or chemotherapy alone. n = number of events; N = number of patients; 95% CI = 95% confidence interval; RR = relative risks; The diamond shows the 95% confidence intervals for the pooled relative risks. Values greater than 1.0 indicate relative risks that favor R-chemo.
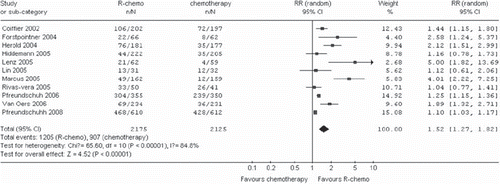
Figure 6. Overall response rate for the subgroups of patients with diffuse large B-cell lymphoma, mantle cell lymphoma or follicular lymphoma receiving rituximab with chemotherapy (R-chemo) or chemotherapy alone. n ˆnumber of events; N ˆnumber of patients; 95% CI = 95% confidence interval; RR = relative risks; The diamond shows the 95% confidence intervals for the pooled relative risks. Values greater than 1.0 indicate relative risks that favor R-chemo.
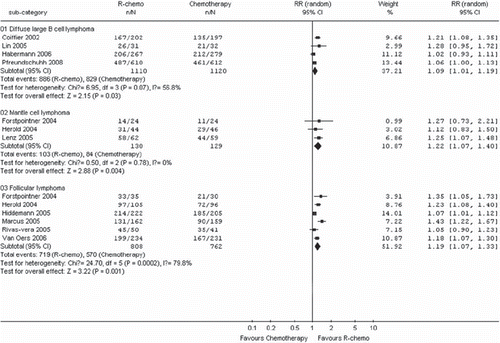
Figure 7. Meta-analysis of disease control for all patients receiving rituximab with chemotherapy (R-chemo) or chemotherapy alone. Disease control is shown as the relative risks (RR) for a disease event (progression, relapse, death). n = number of events; N = number of patients; 95% CI = 95% confidence interval; RR = relative risks; The diamond shows the 95% confidence intervals for the pooled relative risks. Values greater than 1.0 indicate relative risks that favor R-chemo.
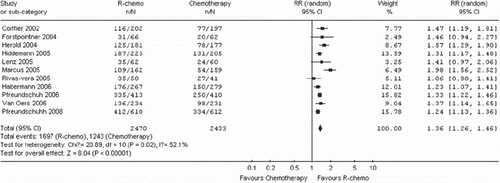
Figure 8. Disease control for the subgroups of patients with diffuse large B-cell lymphoma, mantle cell lymphoma or follicular lymphoma receiving rituximab with chemotherapy (R-chemo) or chemotherapy alone. Disease control is shown as the relative risks (RR) for a disease event (progression, relapse, death). n ˆnumber of events; N ˆnumber of patients; 95% CI =95% confidence interval; RR = relative risks; The diamond shows the 95% confidence intervals for the pooled relative risks. Values greater than 1.0 indicate relative risks that favor R-chemo.
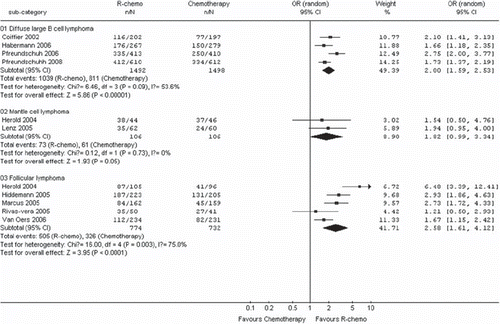
Table II. Summary of toxicity meta-analyses of treatment for B-cell lymphoma among patients receiving rituximab with chemotherapy (R-chemo) or chemotherapy alone*.