Figures & data
Table I. Settings for the CBCT scan.
Table II. Definition of edges of the clipbox used for the image registration.
Figure 1. The visual differences when reducing the number of projections. Slices from the reconstruction using 90% and 75% are omitted because of the very little visual changes. There were too few projection images to reconstruct the CBCT in the 10% case for the H&N patients.
Figure 2. The components of ΔT for the lung and H&N patients. The average translation in each direction left-right (LR), anterior-posterior (AP) and cranio-caudal (CC) are marked with the asterisk symbol, and the error bars shows ± 1 standard deviation.
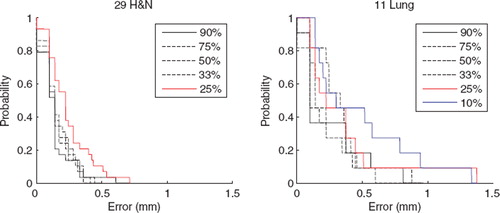
Figure 3. Probability histogram showing the probability of having a translational error of length larger than a given length. It is seen that no deviation larger than 0.7 mm is seen in the H&N group. Likewise, it is seen for the lung group that there is a small probability of deviations above 1 mm, however deviation above 1.4 mm is not observed in any of the reduced data sets.