810
Views
13
CrossRef citations to date
0
Altmetric
ORIGINAL ARTICLE

Variation in position and volume of organs at risk in the small pelvis

, , , , , & show all
Pages 491-499 | Received 11 Nov 2008, Accepted 09 Feb 2010, Published online: 16 Apr 2010

Figures & data

Table I. Demography.

Figure 1. The variation in position measured as the absolute difference (cm) of extreme points compared to a given reference point of each organ at risk in two consecutive CT-scans.
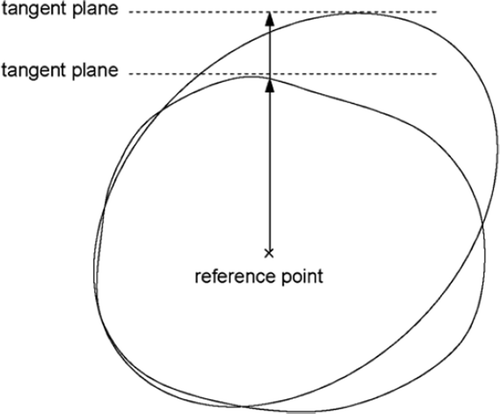
Figure 1. The variation in position measured as the absolute difference (cm) of extreme points compared to a given reference point of each organ at risk in two consecutive CT-scans.

Figure 2. Relative volume (Vmin/Vmax) of the smaller volume compared to the larger volume and relative overlapping (Vo/Vmin) for the organs at risk. The legend shows how the diagrams display relative volume and overlapping of the organs at risk. A value of 1 in relative volume means that the two volumes are equally large. Values approaching 0 means that there is a large difference in volume. A value of 1 in relative overlapping means that the smaller volume lies within the larger volume. A value of 0 means that the two volumes are separated.
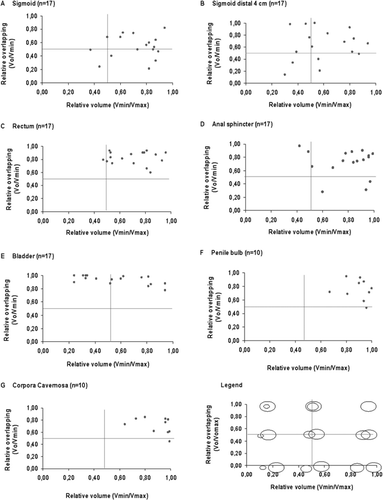
Figure 2. Relative volume (Vmin/Vmax) of the smaller volume compared to the larger volume and relative overlapping (Vo/Vmin) for the organs at risk. The legend shows how the diagrams display relative volume and overlapping of the organs at risk. A value of 1 in relative volume means that the two volumes are equally large. Values approaching 0 means that there is a large difference in volume. A value of 1 in relative overlapping means that the smaller volume lies within the larger volume. A value of 0 means that the two volumes are separated.

Table II. Absolute volume (cm3), relative volume and relative overlapping* in two consecutive CT-scans for seven organs at risk in the small pelvis.

Table III. Mean, median and range of baseline characteristics given in .

Figure 3. Deviation of the extreme points in the organs at risk, CT 2 compared to CT 1. The extreme points in the six directions together define the smallest “box-volume” that encloses the organ at risk. A positive value represents movement in the direction indicated on the x-axis. The diagrams show the mean±1SD and the maximum deviation measured.
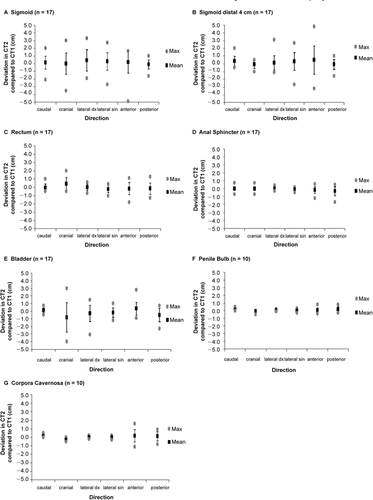
Figure 3. Deviation of the extreme points in the organs at risk, CT 2 compared to CT 1. The extreme points in the six directions together define the smallest “box-volume” that encloses the organ at risk. A positive value represents movement in the direction indicated on the x-axis. The diagrams show the mean±1SD and the maximum deviation measured.

Table IV. Proportion of delineated organs at risk that reaches >0.5 in agreement.

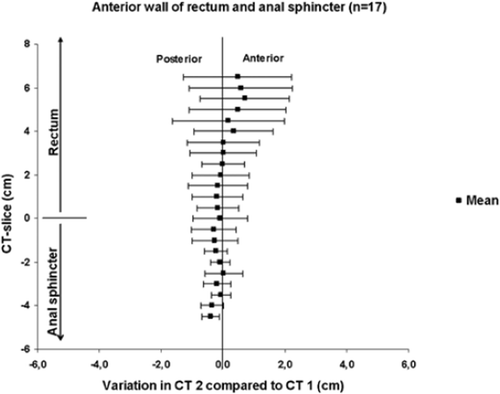
Figure 4. Variation of the anterior wall extreme points of rectum and anal sphincter measured in each CT-slice (0.5 cm thickness) in two consecutive CT-scans in 17 patients (mean and one standard deviation).

Figure 4. Variation of the anterior wall extreme points of rectum and anal sphincter measured in each CT-slice (0.5 cm thickness) in two consecutive CT-scans in 17 patients (mean and one standard deviation).

Reprints and Corporate Permissions

Please note: Selecting permissions does not provide access to the full text of the article, please see our help page How do I view content?

To request a reprint or corporate permissions for this article, please click on the relevant link below:

Academic Permissions

Please note: Selecting permissions does not provide access to the full text of the article, please see our help page How do I view content?

Obtain permissions instantly via Rightslink by clicking on the button below:

If you are unable to obtain permissions via Rightslink, please complete and submit this Permissions form. For more information, please visit our Permissions help page.