Figures & data
Table I. Five-year age-standardised relative survival (%) (RS) with 95% confidence intervals (CI) by site and country for patients diagnosed 1999–2003 and trends in survival 1989–2003. Nordic cancer survival study: Men.
Table II. Five-year age-standardised relative survival (%) (RS) with 95% confidence intervals (CI) by site and country for patients diagnosed 1999–2003 and trends in survival 1989–2003. Nordic cancer survival study: Women.
Table III. Lowest and highest 5-year age-standardised relative survival ratio (RS) 1999–2003 in the Nordic countries* and percentage point difference. Nordic cancer survival study: Men.
Table IV. Lowest and highest 5-year age-standardised relative survival ratio (RS) 1999–2003 in the Nordic countries* and percentage point difference. Nordic cancer survival study: Women.
Table V. Excess mortality rates 1999–2003 per 100 person years; Follow-up interval first three months. Nordic cancer survival study.
Table VI. Excess mortality rates 1999–2003 per 100 person years; Follow-up 2–5 years. Nordic cancer survival study.
Figure 1. Five-year relative survival plotted against excess mortality rates in the first three months following diagnoses in 1999–2003 for cancer patients by country and sex with LOESS curves for the 15 most common cancer sites excluding prostate and breast cancer. Nordic cancer survival study.
Figure 2. Country-specific fitted LOESS curves to plots of 5-year relative survival against excess mortality rates in the first three months following diagnosis in 1999–2003 for male and female cancer patients of the 15 most common cancer sites excluding prostate and breast. Nordic cancer survival study.
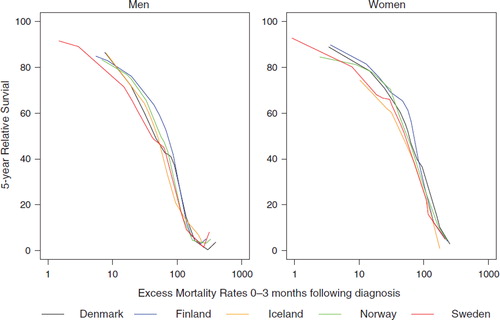
Figure 3. Trends in the proportion of daily smokers in the Nordic countries by sex. (Sources: lines depict data from OECD (reference [Citation36]) while the circles represent data from reference [Citation38]).
![Figure 3. Trends in the proportion of daily smokers in the Nordic countries by sex. (Sources: lines depict data from OECD (reference [Citation36]) while the circles represent data from reference [Citation38]).](/cms/asset/1d0dc830-db9c-49f7-bb4b-b359e915877a/ionc_a_480636_f0003_b.jpg)
Figure 4. Trends in alcohol consumption in the Nordic countries (Source: reference [Citation36]).
![Figure 4. Trends in alcohol consumption in the Nordic countries (Source: reference [Citation36]).](/cms/asset/29327445-70ba-41dd-98cb-de2d9265913b/ionc_a_480636_f0004_b.jpg)