Figures & data
Table 1. Descriptive statistics shown together with medians and ranges for the different uPAR forms.
Figure 1. Kaplan-Meier plots illustrating the estimates of survival probabilities for CRC patients stratified by the levels of the uPAR forms. The upper panel shows the survival estimates for uPAR(I) (a) dichotomized by the LOQ (20.2 fmol/ml). The two lower panels show the survival estimates for suPAR(I–III) (b) and suPAR(I–III)+(II–III)(c) in three groups using the tertiles as cut points. The tertiles for suPAR(I–III) were 32.2 and 46.4 fmol/ml, and 90.3 and 117.9 fmol/ml for suPAR(I–III)+(II–III). The p-values shown are for the log rank statistic. The number of patients at risk at 0, 24, 48 and 72 months in each strata are shown below each plot with the number of events (deaths) shown to the left.
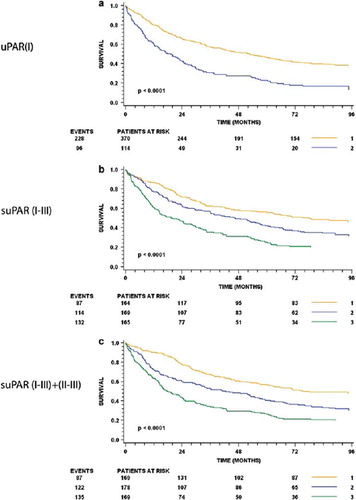
Figure 2. Preoperative serum levels of uPAR(I), suPAR(I–III) and suPAR(I–III)+(II–III) and overall survival for patients with Dukes’ B and Dukes’ C cancer. The upper panel shows the Kaplan-Meier estimates stratified by uPAR(I) (a and b), the middle panel shows the estimates for suPAR(I–III) (c and d) and the lower panel shows the estimates for suPAR(I–III)+(II–III) (e and f). The respective tertiles were used as cut-points. The p-values shown are for the log rank statistic. The number of patients at risk at 0, 24, 48 and 72 months in each strata are shown below each plot with the number of events (deaths) shown to the left.
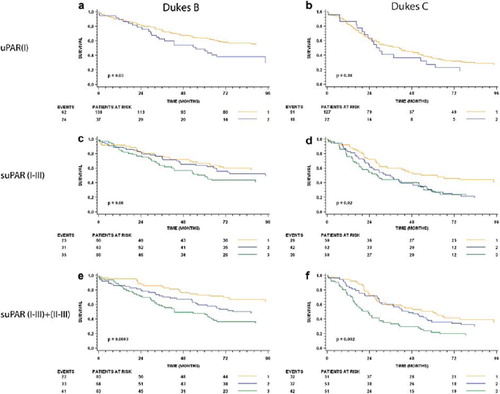
Table 2. Uni- and multivariable regression analyses in 483 colorectal cancer patients.