Figures & data
Figure 1. Histological images (a) and plots of Gd-DTPA concentration versus time for single voxels located in necrotic (●,■) or viable (○,□) tissue (b) of representative T-22, V-27, and Z-98 tumors.
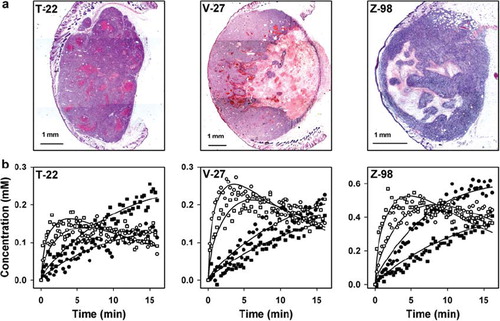
Figure 2. A histological image and parametric MR images and frequency distributions of νe, a, C1min, and SIT2W for a representative V-27 tumor.
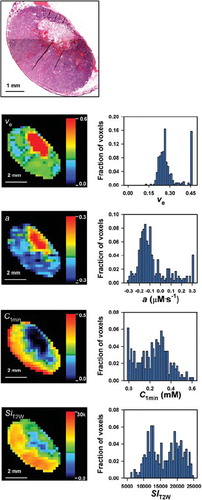
Figure 3. Frequency distributions of νe, a, C1min, and SIT2W for viable and necrotic tissue in T-22, V-27, and Z-98 tumors. Each frequency distribution represents pooled data from five tumor regions.
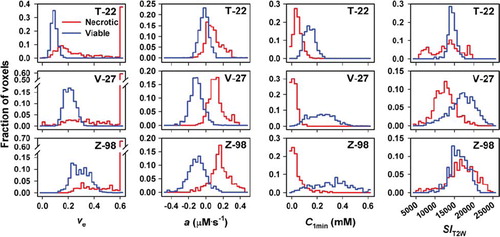
Figure 4. Fraction of necrotic tissue assessed by MRI (NFMRI) versus fraction of necrotic tissue assessed by histological analysis (NFhist) for T-22, V-27, and Z-98 tumors. NFMRI refers to the fraction of voxels with numerical values of νe, a, C1min, and SIT2W outside those detected in viable tissue in each of the tumor lines. The solid lines were fitted to the data by regression analysis. The dashed lines represent theoretical one-to-one correlations.
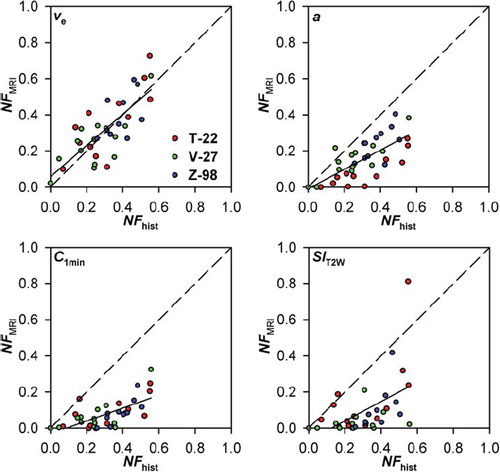
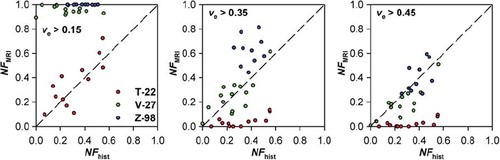
Figure 5. Fraction of necrotic tissue assessed by MRI (NFMRI) versus fraction of necrotic tissue assessed by histological analysis (NFhist) for T-22, V-27, and Z-98 tumors. NFMRI refers to the fraction of voxels with νe values > 0.15, 0.35, and 0.45. The dashed lines represent theoretical one-to-one correlations.