Figures & data
Figure 1. (A) Survival curves of melanoma-bearing mice in different treatment groups. The median survival times of mice in the (1) solvent control; (2) DTIC (40 mg/kg) (DTIC-40); (3) DTIC (80 mg/kg) (DTIC-80); (4) gold-1a (0.125 mg/kg) (Gold-0.125) and (5) gold-1a (0.25 mg/kg) (Gold-0.25) groups were 20 days, 20 days, 26 days, 26 days and 32 days after tumor inoculation respectively. *p < 0.05, compared to solvent control and DTIC-40 groups. #p < 0.05, compared to all other four groups. (B) Morphologies of melanoma-bearing mice and sizes of the tumors in different experimental groups. (C) A plot of tumor volume versus the number of days post tumor inoculation of melanoma-bearing mice in different groups. *p < 0.05, compared to solvent control and DTIC-40 groups. Data were shown as mean ± SEM from five mice in each group. (D) A plot of body weight versus the number of days post tumor inoculation of mice in different groups. There was no significant difference in the body weights of mice in different groups. Data were shown as mean ± SEM from five mice in each group.
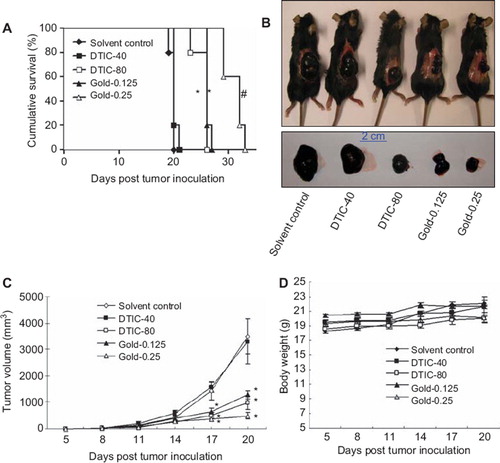
Figure 2. (A) H & E staining of tumor tissues in different treatment groups. Larger necrotic areas were found in the tumor tissues of gold-1a treated (at both doses) melanoma-bearing mice, compared to those in the solvent control group. DTIC was effective in inducing tumor tissue necrosis only when treated at a relatively high concentration (80 mg/kg), but not at a lower concentration (40 mg/kg). Pictures were taken at 200× magnification. Arrows point to necrotic areas. DTIC-40: DTIC (40 mg/kg); DTIC-80: DTIC (80 mg/kg); Gold-0.125: gold-1a (0.125 mg/kg); Gold-0.25: gold-1a (0.25 mg/kg). (B) In situ cell death detection in the tumor tissues in different treatment groups. The numbers of apoptotic cells in the gold-1a-treated (both 0.125 mg/kg and 0.25 mg/kg) groups were obviously higher compared to those in the solvent control group. DTIC was effective in inducing apoptosis only when treated at a relatively high concentration (80 mg/kg), but not at a lower concentration (40 mg/kg). Pictures shown were taken at 320× magnification. Arrows point to apoptotic nuclei. DTIC-40: DTIC (40 mg/kg); DTIC-80: DTIC (80 mg/kg); Gold-0.125: gold-1a (0.125 mg/kg); Gold-0.25: gold-1a (0.25 mg/kg). Data are shown as mean ± SEM of three mice per treatment group. *p <0.05, compared to solvent control. (C) Immunohistochemical detection of CD31 in the melanoma tissues of mice in different treatment groups. iMVD was significantly lower in the gold-1a (0.25 mg/kg) group, compared to the solvent control group. Pictures shown were taken at 100× magnification. Arrows point to CD31-positive microvessels. DTIC-40: DTIC (40 mg/kg); DTIC-80: DTIC (80 mg/kg); Gold-0.125: gold-1a (0.125 mg/kg); Gold-0.25: gold-1a (0.25 mg/kg). Data are shown as mean ± SEM of three mice per treatment group. *p < 0.05, compared to solvent control.
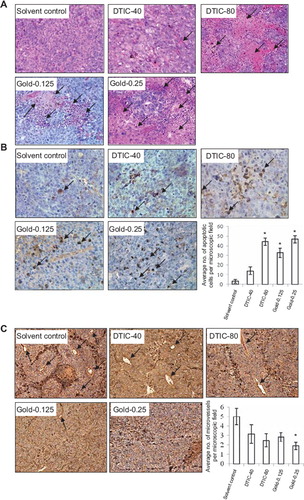
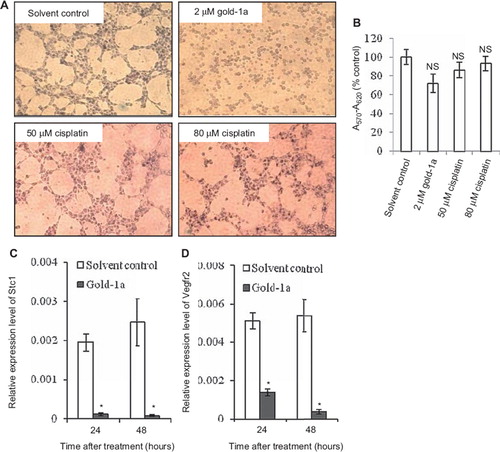
Figure 3. (A) In vitro angiogenesis assay. Gold-1a significantly inhibited tube formation by MS1 mouse endothelial cells at 2 μM. In contrast, high concentration of cisplatin (80 μM) did not inhibit tube formation. Data shown are representative pictures from two independent experiments. (B) Treatment with gold-1a or cisplatin at the concentrations the same as those used in the tube formation assay for two hours did not cause significant death of MS1 cells. MTT assay was performed to determine the percentages of viable cells. A570-A620 values obtained from untreated cells were normalized as 100%, and the data were shown as mean ± SEM from three independent experiments. NS, not statistically significant. (C and D) Expression profiles of Stc1 and Vegfr2 in MS1 cells in response to gold-1a treatment, as determined by qRT-PCR. Cells were treated either with solvent control or with 2 (M of gold-1a for 24 or 48 hours. The relative expression levels were compared to those of Gapdh. Data are shown as mean ± SEM from five independent experiments. *p < 0.05, compared to solvent control.