8,667
Views
54
CrossRef citations to date
0
Altmetric
Research Article

MRI quality assurance using the ACR phantom in a multi-unit imaging center

, , , , , , & show all
Pages 966-972 | Received 15 Mar 2011, Accepted 11 Apr 2011, Published online: 18 Jul 2011

Figures & data

Table I. Imaging parameters of the ACR sequences [Citation16].

Table II. Imaging parameters of site T1-weighted sequences of different systems.

Table III. Imaging parameters of site T2-weighted sequences of different systems.

Figure 1. Examples of ACR phantom images. In slice 1 the hole-array pairs are used for high-contrast spatial resolution and the ramps in the middle for slice thickness accuracy. Slice 5 together with measurements from slice 1 and the sagittal image are used for the geometric accuracy determination. Image intensity uniformity is determined from slice 7 and slices 8 to 11 are used for low-contrast object detectability measurement.
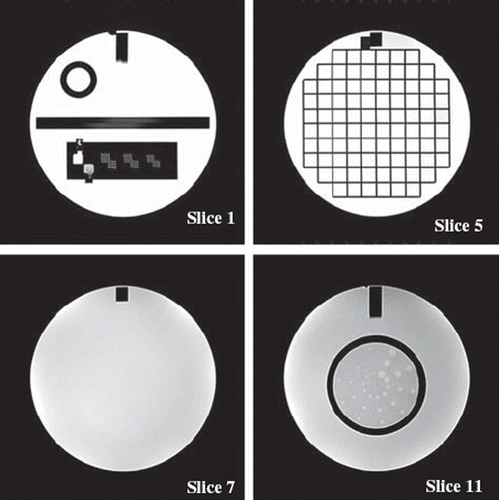
Figure 1. Examples of ACR phantom images. In slice 1 the hole-array pairs are used for high-contrast spatial resolution and the ramps in the middle for slice thickness accuracy. Slice 5 together with measurements from slice 1 and the sagittal image are used for the geometric accuracy determination. Image intensity uniformity is determined from slice 7 and slices 8 to 11 are used for low-contrast object detectability measurement.

Figure 2. Image intensity percent integral uniformity of a. ACR T1, b. ACR T2, c. site T1 and d. site T2 sequences. The dash lines indicate the ACR recommended acceptance values for 1.5 T (87.5%) and 3.0 T (82%).
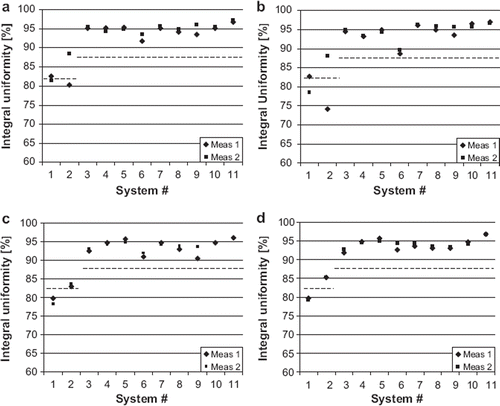
Figure 2. Image intensity percent integral uniformity of a. ACR T1, b. ACR T2, c. site T1 and d. site T2 sequences. The dash lines indicate the ACR recommended acceptance values for 1.5 T (87.5%) and 3.0 T (82%).

Figure 3. Slice thickness accuracy; the nominal value is 5 mm with ±0.7 mm tolerance, limits indicated by dash lines. a. ACR T1, b. ACR T2, c. site T1 and d. site T2 sequences.
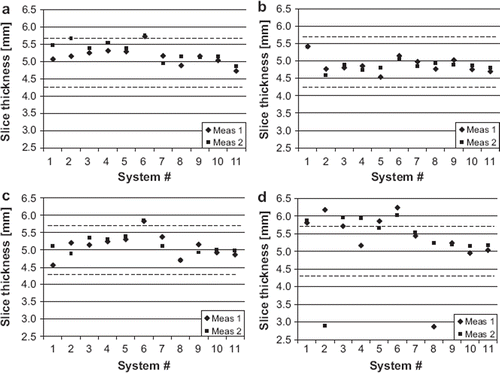
Figure 3. Slice thickness accuracy; the nominal value is 5 mm with ±0.7 mm tolerance, limits indicated by dash lines. a. ACR T1, b. ACR T2, c. site T1 and d. site T2 sequences.

Figure 4. Low contrast detectability of measurements 1 and 2 for a. T1-weighted sequences and b. T2-weighted sequences. The dash lines indicate the ACR recommended acceptance values for 1.5 T (9 objects) and 3.0 T (37 objects).
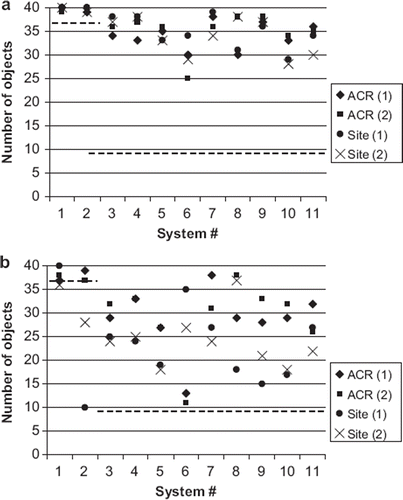
Figure 4. Low contrast detectability of measurements 1 and 2 for a. T1-weighted sequences and b. T2-weighted sequences. The dash lines indicate the ACR recommended acceptance values for 1.5 T (9 objects) and 3.0 T (37 objects).

Table IV. High contrast spatial resolution of site sequences.

Table V. Percentages of the systems that passed the ACR recommended acceptance criteria in each test.

Reprints and Corporate Permissions

Please note: Selecting permissions does not provide access to the full text of the article, please see our help page How do I view content?

To request a reprint or corporate permissions for this article, please click on the relevant link below:

Academic Permissions

Please note: Selecting permissions does not provide access to the full text of the article, please see our help page How do I view content?

Obtain permissions instantly via Rightslink by clicking on the button below:

If you are unable to obtain permissions via Rightslink, please complete and submit this Permissions form. For more information, please visit our Permissions help page.