Figures & data
Figure 1. The three imaging positions of the phantom in the MR- and CT scanner, where (a) shows image position 1, and (b) and (c) shows image positions 2, rotated 45°, and 3, rotated 90° relative to position 1, respectively.
Figure 2. The FMA delineations performed in the T1W- and DW images (1.5–3T), for all b-values and phantom positions 1, 2 and 3. The red- and cyan colored delineations represent the FMA contours performed on DW images with the PE direction applied in the lateral- and vertical direction, respectively. The dark-blue colored contouring presents the FMA delineation performed on the T1W images. The 1.5T MR images (a), (c) and (e) has the lateral- and vertical PE in the anterior-posterior (AP)- and right-left (RL) direction, whereas the 3T MR images (b), (d) and (f) has the corresponding PE in the PA- and LR direction.
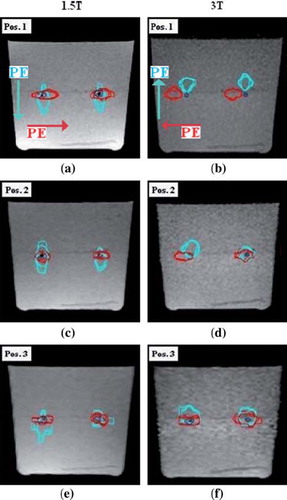
Table I. The mean shift of the CoG position including range of the CoG position of the delineated FMA volumes on DW images acquired at phantom position 1, 2 and 3, relative reference T1W images, for the 1.5- and 3T MR scanner, respectively. PE-, FE- and SE correspond to the phase-, frequency- and slice encoding direction in the image.
Table II. The estimated mean FMA volumes (in cm3) on T1W and DW images (1.5–3T), generated at phantom position 1, 2 and 3, respectively, as well as the calculated mean DSC value for corresponding FMA volumes.
Figure 3. The lateral intensity line profile across the two reconstructed FMAs on 1.5T DW image slices, acquired with phantom in position 1; (a) and (c) shows DW image slices for b-value 0 and the PE direction applied in the anterior-posterior (AP) and right-left (RL) direction, respectively, (b) and (d) shows DW image slices for b-value 1000 with the PE direction applied in the AP- and RL direction, respectively.
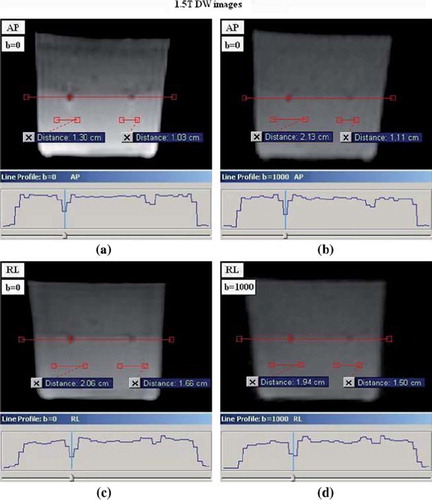
Figure 4. The lateral intensity line profile across the reconstructed FMAs in 3T DW image slices, obtained with phantom in position 1; (a) and (c) shows DW image slices for b-value 0 and the PE direction applied in the posterior-anterior (PA) and left-right (LR) direction, respectively, (b) and (d) shows DW images for b-value 1000 and the PE direction applied in the PA- and LR direction, respectively.
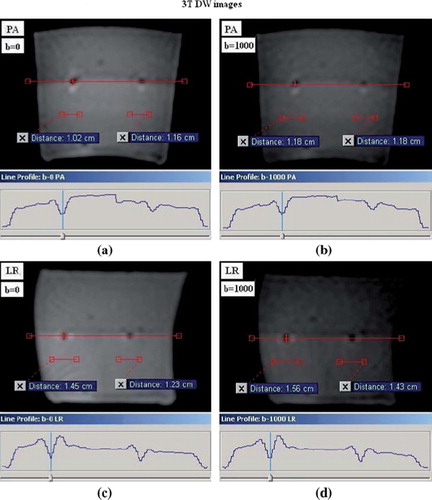
Table III. The estimated mean size of FMAs in the PE-, FE- and SE direction on DW images, for phantom in imaging positions 1, 2 and 3 and for both MR scanners.