Figures & data
Table I. Nomenclature and description of the treatment plans. For the volumetric modulated arc therapy plans the monitor units have been set to 200 MUs and 400 MUs.
Figure 1. Depth dose curve for 6 MV and 15 MV photon beam at FS 10 × 10 cm2 and 40 × 40 cm2.
Figure 2. A comparison of measured and calculated profiles using both Acuros XB and AAA at d = 1.5 cm, 10 cm and 300 cm for 6 MV photons. Only half of the (symmetric) profiles are shown. FS: 1 × 1 cm2, 10 × 10 cm2, 20 × 20 cm2 and 40 × 40 cm2.
Figure 3. Measured and calculated (Acuros XB and AAA) profiles for the asymmetric half beam field 20 × 10 (Y1 = −20, Y2 = 0) at d = 10 cm and SSD = 90 cm.
Table II. Percentage of points fulfilling the Gamma (3,3) agreement index for the treatment plans delivered with 6 MV and 15 MV photons. The mean value and standard deviation has been calculated for each energy. The treatment plans are specified in Table I.
Figure 4. Comparison of the dose measured at the films at a point centrally in the vertebral body for all 22 treatment plans, to the dose calculated at the same point for the two algorithms. The deviation in dose is given as (Dfilm – Dcalculated)/Dfilm*100. The plan number is specified in .

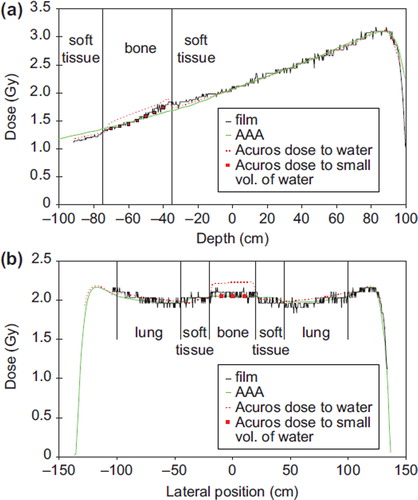
Figure 5. a) Depth dose curves evaluated at the central axis of the thorax phantom for the field “AP” delivered with 6 MV photons. b) Lateral profile for the field “Lat op” delivered with 6 MV photons. The profile is evaluated at the depth of the vertebral body. The calculation of dose to a small volume of water in the vertebral body was performed for Acuros XB for a few points for both fields.